Estimation of ecosystem extent on the base of landscape-land cover classes (LLCCs)
The methodology and results will be described in detail in a forthcoming publication
The intersection of the map of landscape zones with land cover data provides the map of landscape-land cover classes (LLCCs), which takes into account the landscape and geographical specificity of terrestrial ecosystems and tracks changes in their area if land cover data is updated.
LLCCs can be interpreted as a proxy for ecosystems, and the LLCC map can be seen as a prototype of an ecosystem map for ecosystem accounting.
We tested this approach using the same data as for assessment of natural landscapes extent: two land cover datasets: ESRI 2023 and 2017, and ESA 2021, ant the map of landscape zones published in the Fifth National Report of Armenia to the CBD (2014) was used (available in digital form in Forest Atlas of Armenia FAA).
Landscape zones Land cover ESA 2021 Land cover ESRI 2023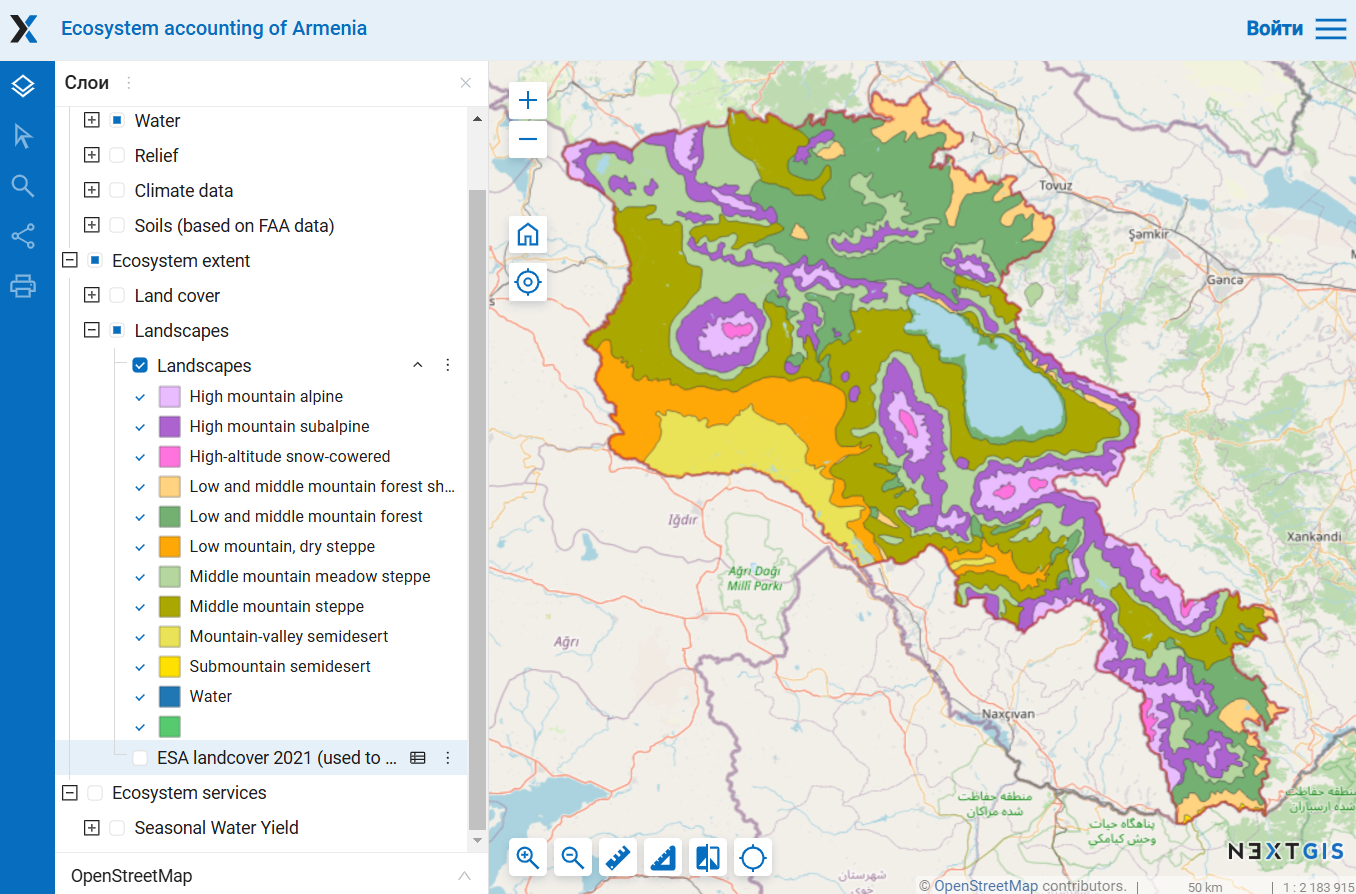
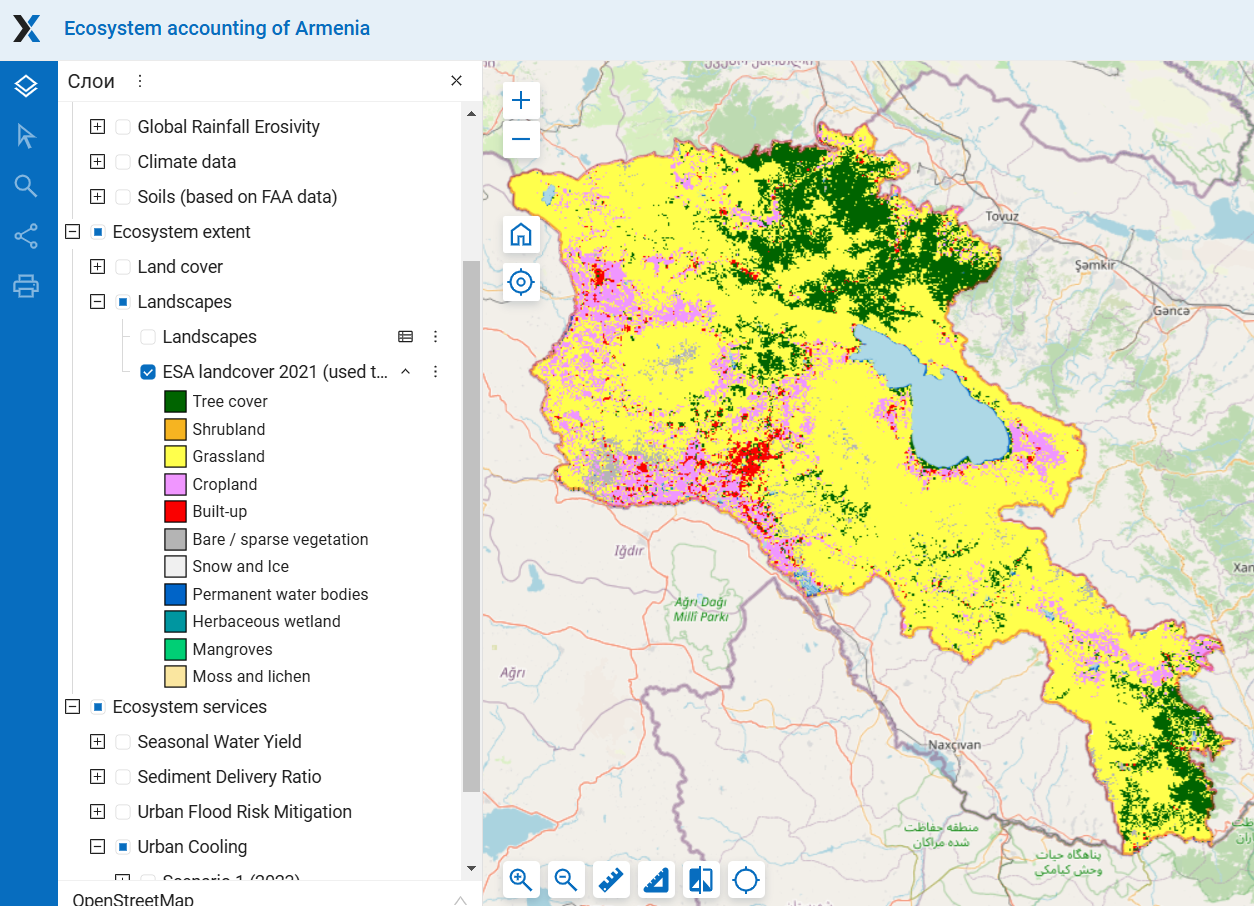
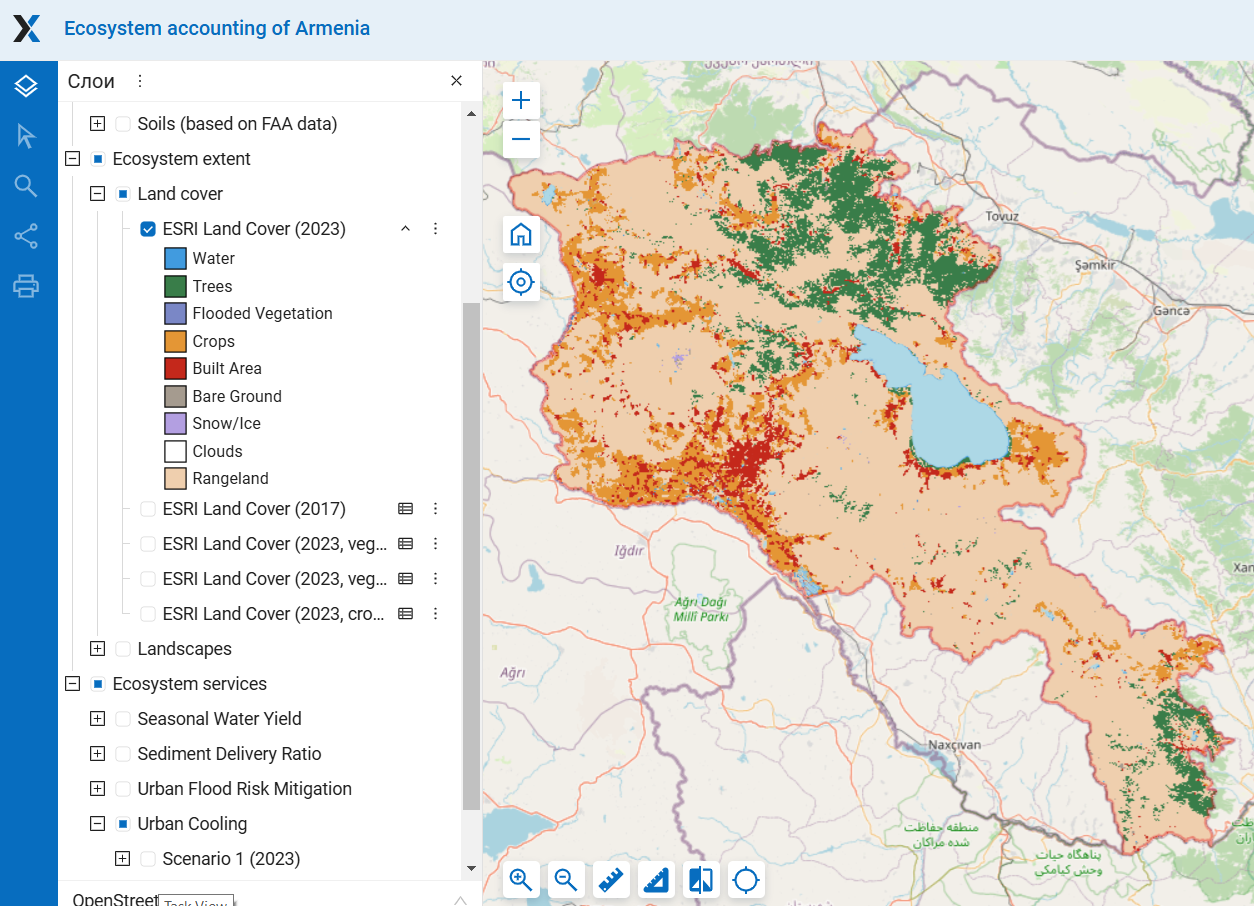 For detailed maps see section “Ecosystem extent”
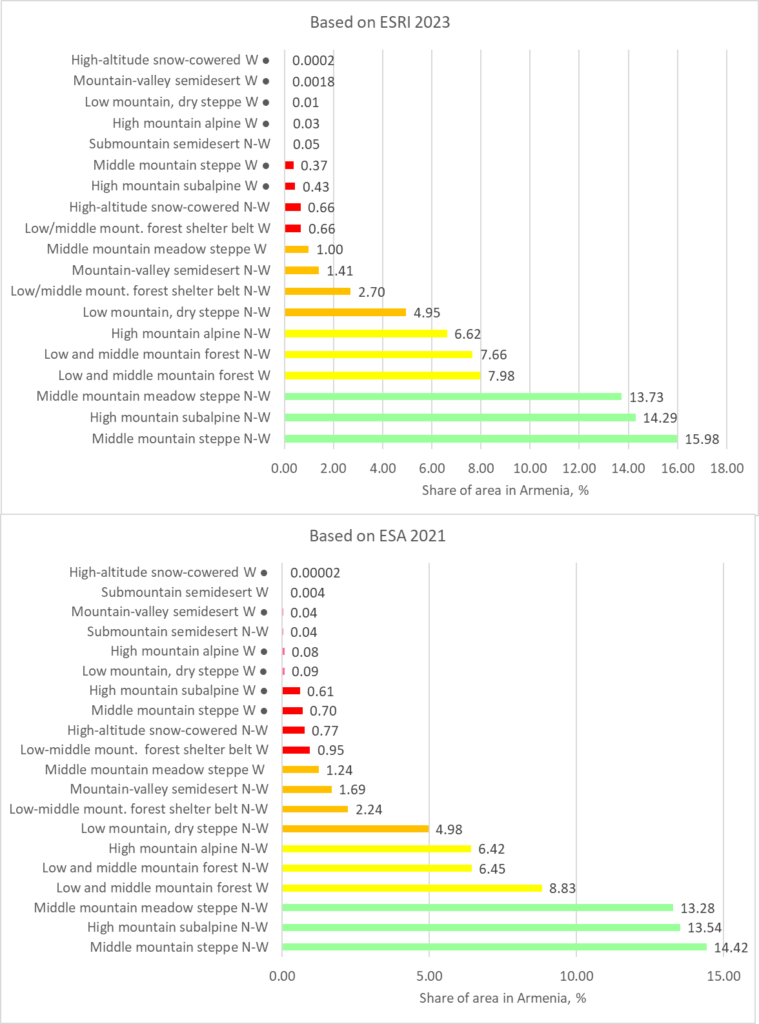
Intersection of ten landscape zones with six terrestrial natural land cover classes of ESA dataset (tree cover, shrubland, grassland, moss and lichen, bare and sparse vegetation, snow and ice), and four analogous classes of ESRI dataset (trees, rangelands, bare ground, snow/ice) resulting in 60 and 40 combinations consequently. We called these combinations landscape-land cover classes (LLCCs) because, at this stage of analysis, we cannot define exactly what real ecosystems they represent. For simplicity of analysis, they were grouped into 20 combinations, namely, woody (W) and non-woody (N-W) LLCCs in each landscape zone.
1. Extent and rarity of LLCCs
These LLCCs were ranked by area, and their rarest types were identified. Despite the differences in ESA and ESRI land cover data, which are briefly described in the section on landscapes, the rarity rankings of LLCCs based on them are almost identical.
Ranking LLCC types by their area; woody LLCCs are indicated as W, non-woody as N-W; LLCCs occupying no more than 5% of the zone’s area are marked with a ‘●’ symbol
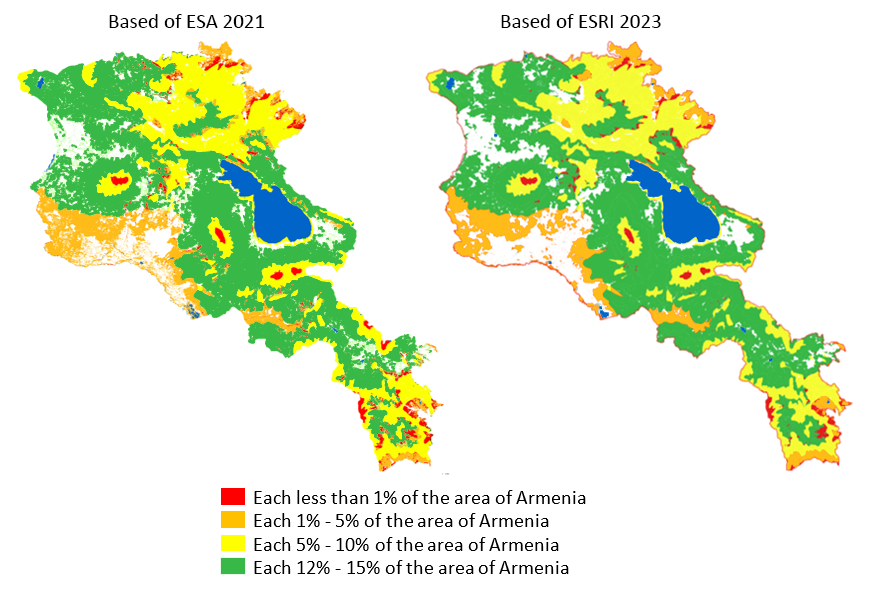
Accordingly, the ecosystem rarity maps which based on these rankings are also very similar.
The proportion of the area of natural landscapes and LLCCs within each province relative to their total area in Armenia, %
Statistical tables
Opening the image in a new window will allow you to view it slightly larger
ESRI 2023
ESA 2021
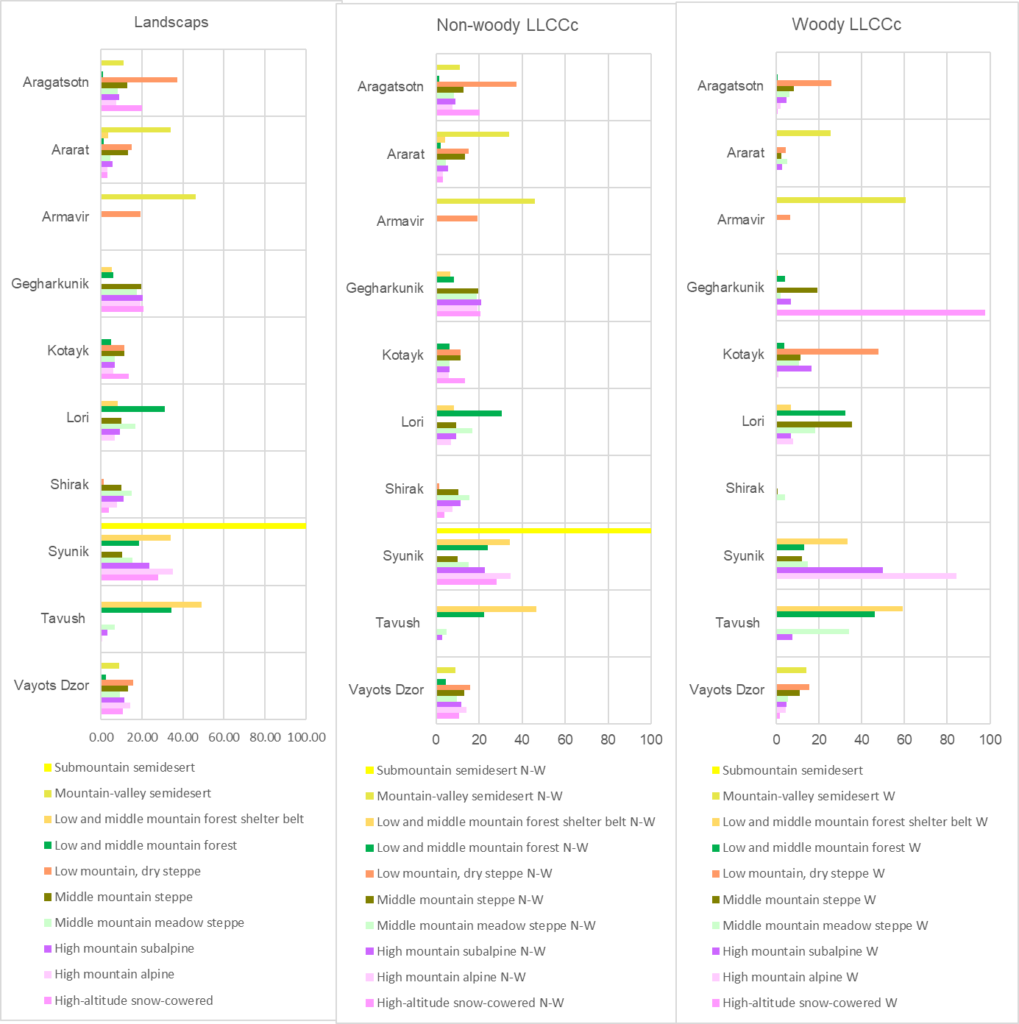
2. Assessment of the importance of provinces for conserving LLCC diversity in Armenia
To assess the importance of provinces for conserving LLCC diversity in Armenia, we used the indicator of the total share of LLCCs areas located within each province. In this case, we do not used the indicator of the share of the LLCC area in Armenia, as in the LLCC rarity ranking above. We used the share of LLCC area within the province relative to the total area of that LLCC in Armenia. This approach was applied to ensure that the value of rare LLCC is not diminished.
In the province rankings based on ESRI and ESA data, only the first province (Syunik) and the last one (Shirak) remain the same. Within the rankings, the positions of other provinces change. It is also notable that, according to ESA data, the total share of LLCCs in Syunik is 1.5 times larger than that in ESRI data.
The rankings of provincial importance for conserving LLCCs in Armenia. The rarest LLCCs are shown in red, the less rare ones in orange, the relatively common in yellow, and the most common in green. The total percentage for provinces can exceed 100%.
Statistical tables
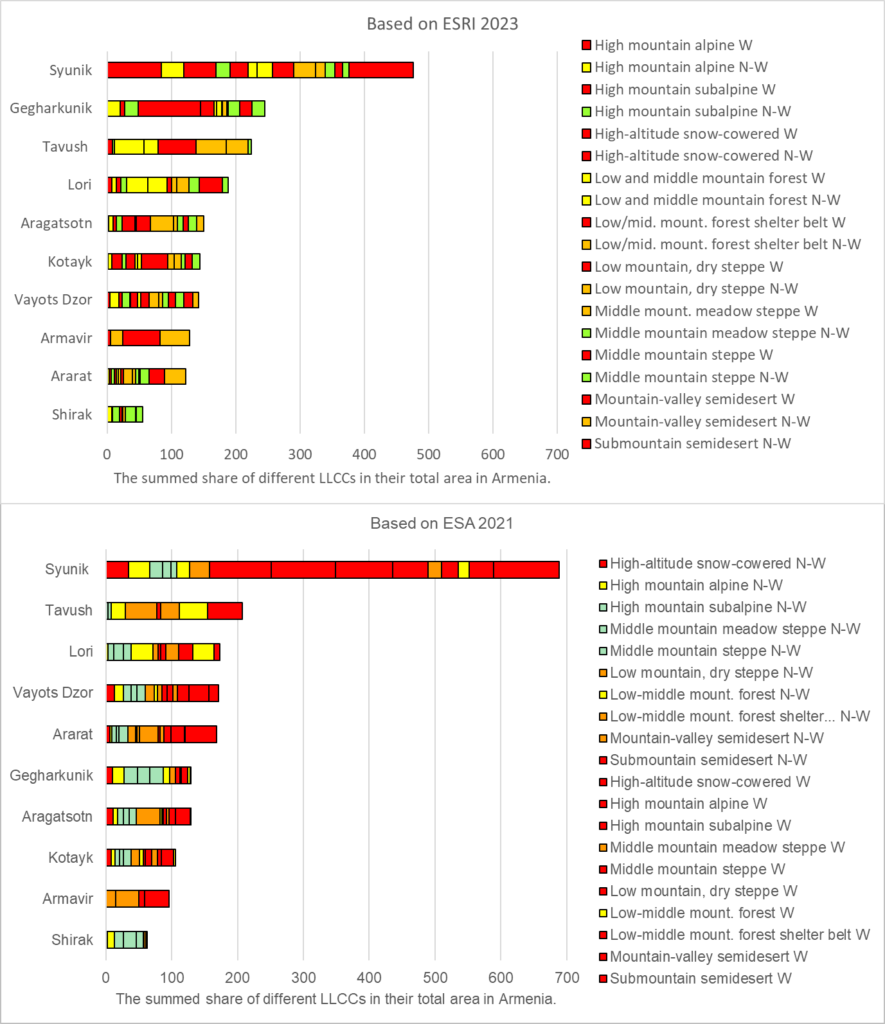
When using such an indicator, the largest contribution to the ranking is made by the rarest types of LLCCs, which may be errors in the land cover datasets. For example, the very high total indicator for the Syunik province based on ESA data is due to the fact that all or almost all pixels of three rare LLCCs (woody areas in high-altitude snowy and alpine zones, and in sub-mountain semidesert) are concentrated there, which is not the case according to ESRI data. At the same time, according to ESRI data, the Gegharkunik province ranked second because, in this case, almost all woody pixels in the high-altitude snowy zone are concentrated there. It is evident that all these ultra-rare LLCCs may be errors in the land cover datasets.
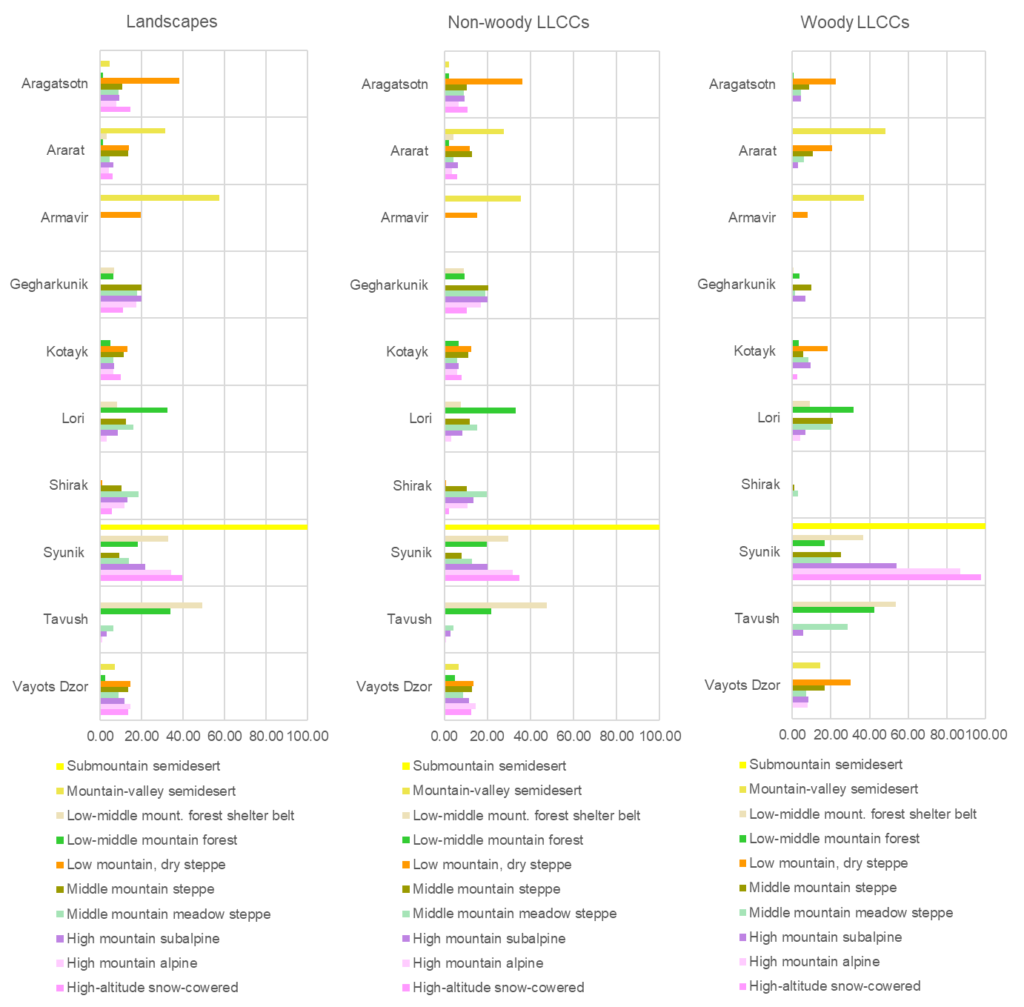
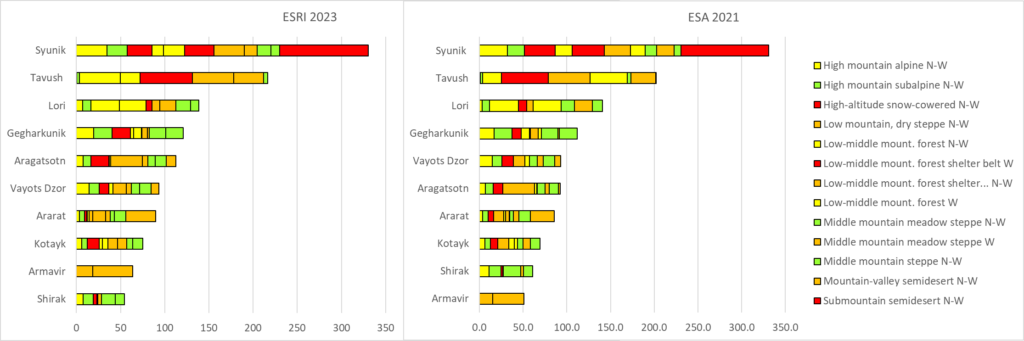
If the rarest LLCCs, occupying no more than 5% of the zone’s area (marked with a ‘●’ symbol in above figure), are excluded from the calculations, the province rankings based on ESRI and ESA data become more similar, although in the middle of the list, some provinces with similar indicators occupy different positions.
The rankings of provincial importance for conserving LLCCs in Armenia. The rarest LLCCs occupying no more than 5% of the zone’s area, are excluded. The total percentage for provinces can exceed 100%
Statistical tables
The map and rankings of LLCCs are suitable for assessing the extent and changes of relatively common ecosystem types, which are less affected by land cover errors. LLCC-based analysis cannot be used to evaluate the rarest LLCCs which can be classification errors and should be excluded from the list of natural ecosystems. For assessing rare and unique ecosystems, a different map created using alternative methods is required.
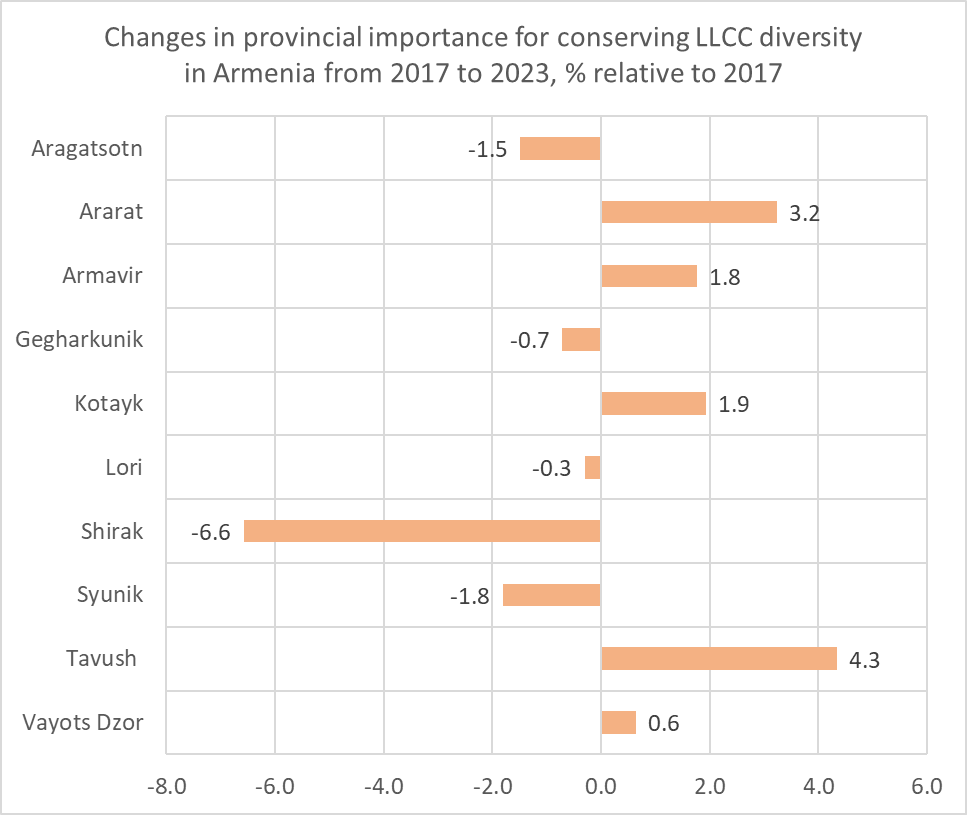
3. Changes in LLCC extent and the provincial importance from 2017 to 2023
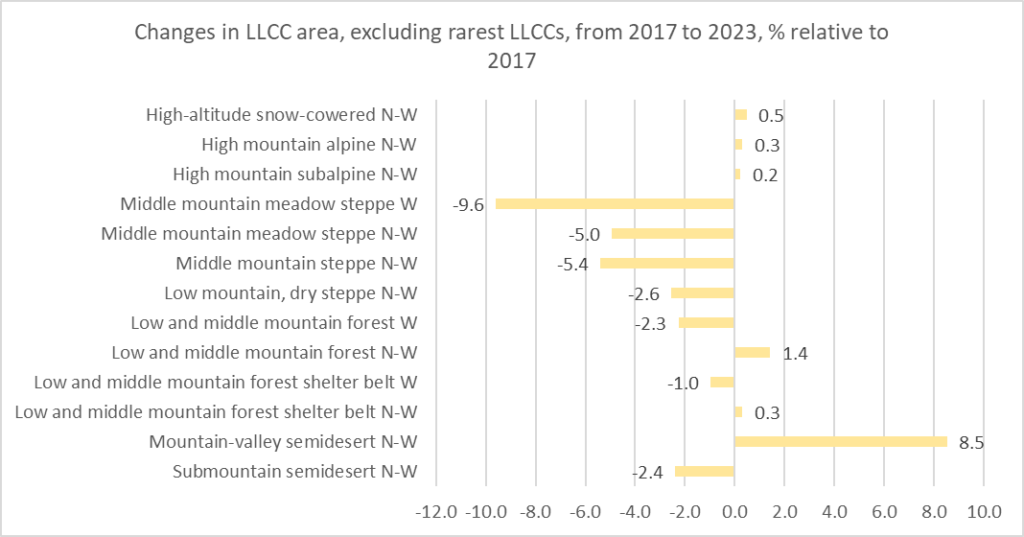
Changes in LLCC extent from 2017 to 2023. The rarest LLCCs occupying no more than 5% of the zone’s area, are excluded.
Changes in provincial importance for conserving LLCCs from 2017 to 2023. The rarest LLCCs occupying no more than 5% of the zone’s area, are excluded.