Management implications arising from ecosystem accounting data
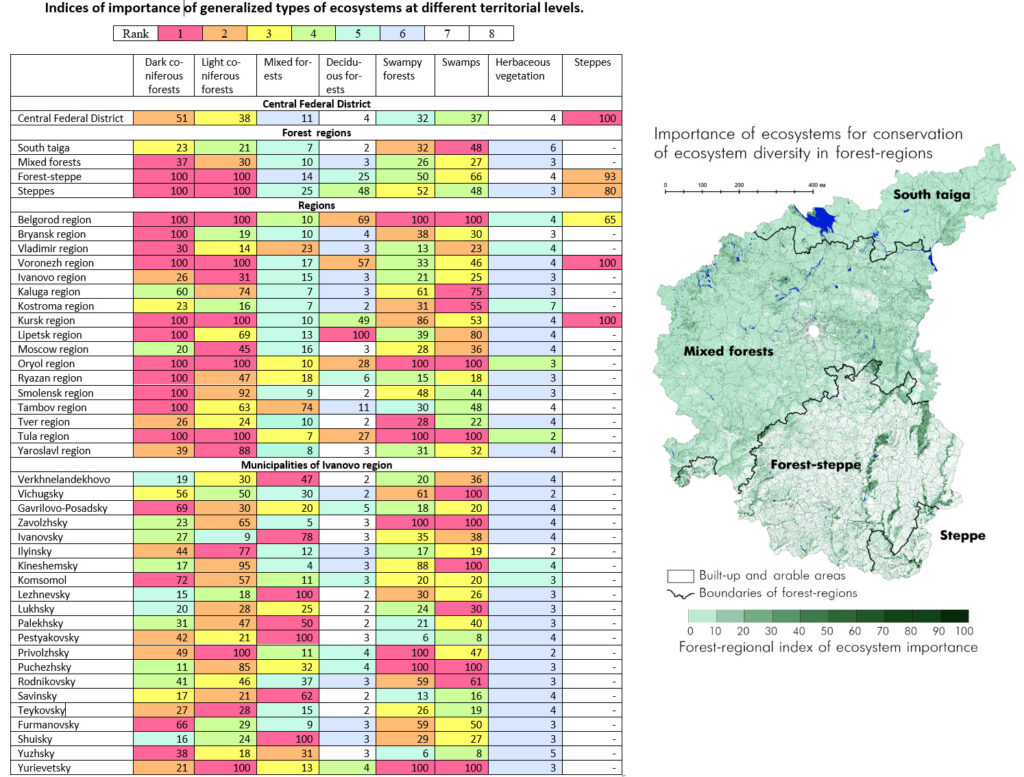
1. Defining priority ecosystems and territories for biodiversity conservation at different levels of territorial administration. Methodology to define priority types of ecosystems and priority territories for conservation of ecosystem diversity was tested for Central Federal District of RF (see here). Based on data on the share of ecosystem area (point 2 here), their rarest types are identified and ecosystems are ranked according to their value for preserving ecosystem diversity at different levels of territorial administration.
Ranking of ecosystem types
Ranking of territories for protection of ecosystem diversity
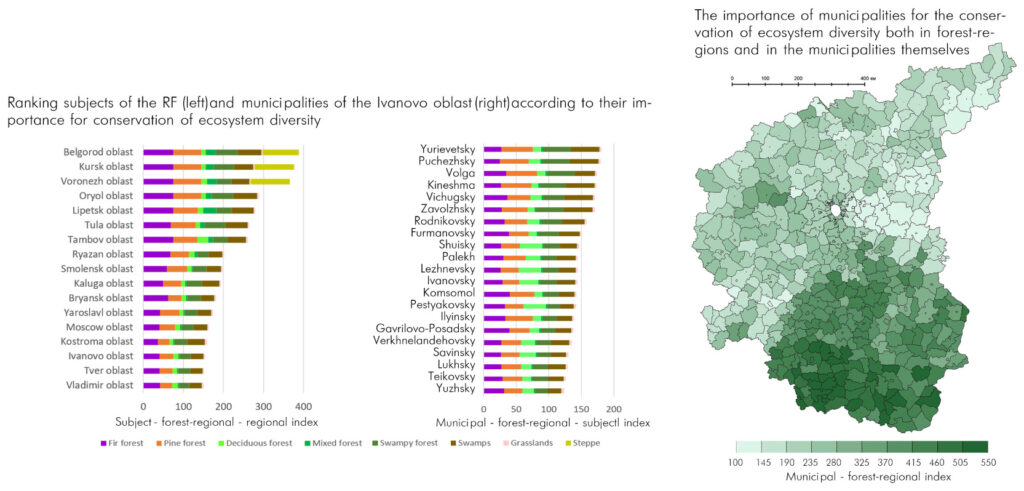
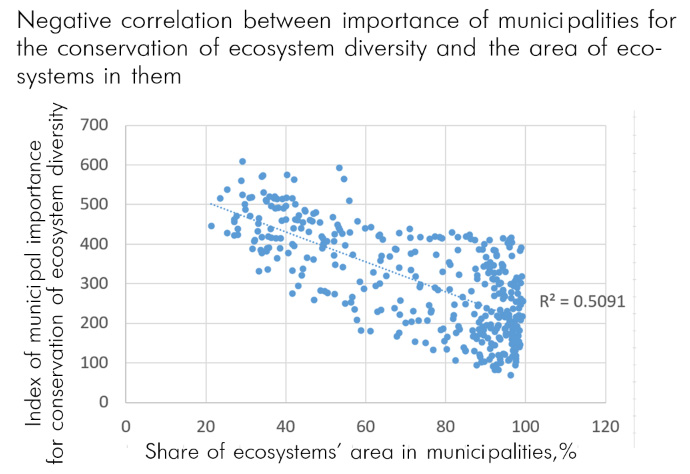
Thus, data on ecosystem area in regions and municipalities can be used to identify environmental priorities. However, our results raise the following question: do the priorities for the conservation of rare ecosystems and large intact natural areas correspond to each other? Based on the criterion of prioritization of rare ecosystems, the most important for biodiversity conservation are territories that have been most strongly transformed by man where few natural ecosystems remain (the south part of CFD in above figure). This determines the negative correlation between importance for the conservation of ecosystem diversity and the total area of natural ecosystems (see figure below). This reflects two aspects of the anthropogenic threat to natural ecosystems: the threat of shrinking their area and the threat of loss of their diversity. These two aspects must be taken into account when developing environmental programs
2. Using indicators of species diversity for management decisions. Obvious indicators are only trends in changes in these indicators – their deterioration or improvement. Formal static indicators of species diversity can only be used for decision-making taking into account the specifics of ecosystems and regions.
Different types of ecosystems typically have different species diversity, so it is incorrect to prioritize these types of ecosystems by species diversity (see about optimal biodiversity). A high-mountain grassland or swamp with typically low species diversity is not a less valuable ecosystem than a forest or meadow with high diversity. Indicators of the number of red-book species in a given territory strongly depend on the degree of its survey, which should always be kept in mind when prioritizing territories.
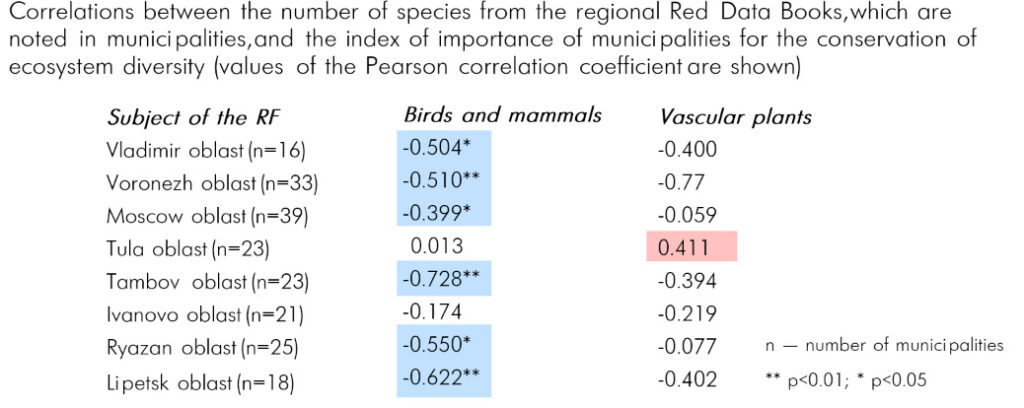
For the Central Federal District of RF, we found predominantly negative correlations
between the the importance of municipalities for the conservation of ecosystem diversity and number of Red Data Book species of birds and mammals (for details see here). For plants, correlations are either absent or positive (Tula region). Perhaps negative correlations indicate that the areas of rare ecosystems are insufficient for the habitat of the Red Data Book species of birds and mammals, but sufficient for vascular plants. The tasks of preserving the diversity of species and ecosystems are two key aspects of biodiversity conservation. They are not interchangeable, but complementary to each other. Different species require different areas of habitat. Therefore, importance indices for large and widely roaming species may conflict with importance indices for the conservation of rare ecosystems. For smaller and less mobile species, this contradiction disappears. Moreover, it is precisely small areas of rare types of ecosystems that are often critical for the conservation of “Red Book” species of plants and insects.
3. Estimating ability of ecosystems to meet human needs. It was shown, that in some regions, ES are no longer sufficient to provide acceptable environmental quality (Report 1 and). Examples are shown below:
a) deficit or excess in the securing of water quality by freshwater ecosystems (negative values, red spectrum – the volume of untreated wastewater; positive values, green spectrum – unused capacities of ecosystems to purify wastewater (m3/ha/year);
b) the level of use of runoff volume secured by terrestrial ecosystems – “ecosystem runoff” unused by people (positive values, green spectrum) or water use exceeds “ecosystem runoff” (negative values, red spectrum), m3/ha/year;
c) satisfaction of the demand for air purification – share of pollutants absorbed by suburban forests (%).

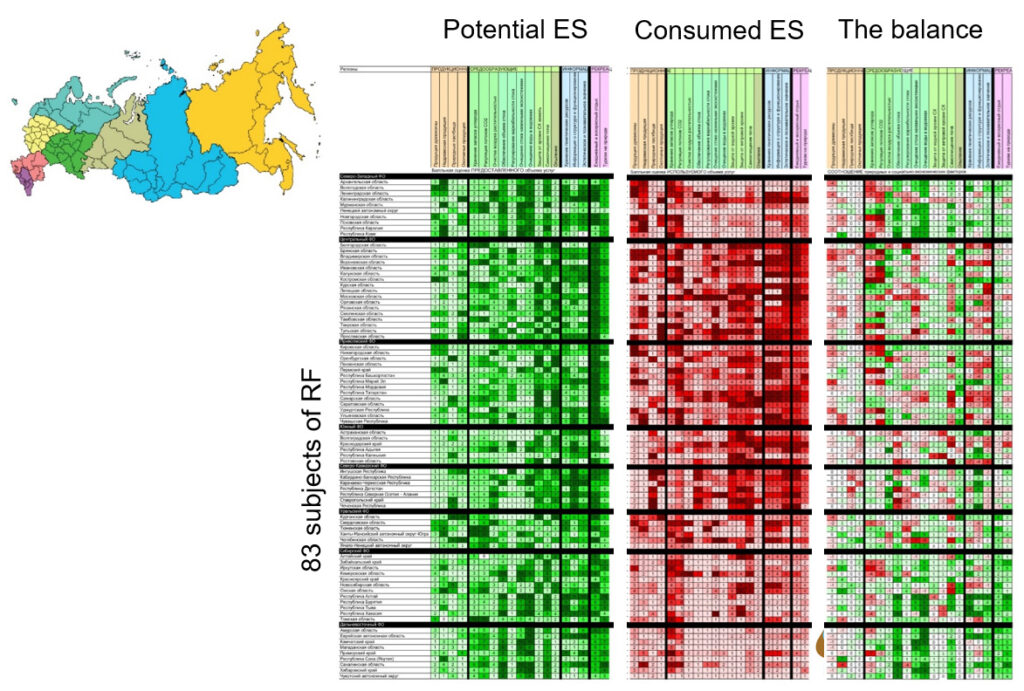
4. Inter-regional comparisons of ES. The matrix of regional ES showed the balance between potential and consumed ES and thus, regions-providers and regions-consumers of ES (page 88 here).
5. An economic value of ES can be estimated on the basis of physical volumes of provided and used ES (see the Section about ES estimating and mapping). For this purpose, the market price of natural goods, water tariffs, fines for environmental pollution, fees for environmental cleanup, the price of technical means that detect ecosystem services (for example, wastewater treatment or erosion control structures and measures) or other methods of economic assessment can be used (Section 6.2 in Report 2).
The importance of ES for the economies of different regions varies greatly. We estimate economic value of selected provisioning and regulating ES consumed in Russia in 2018. The total value was estimated as 3,6% of GDP. However, in some regions the estimated ES have a significant economic value, comparable to 10-56% of the regional gross product (Section 6.2 in Report 2).
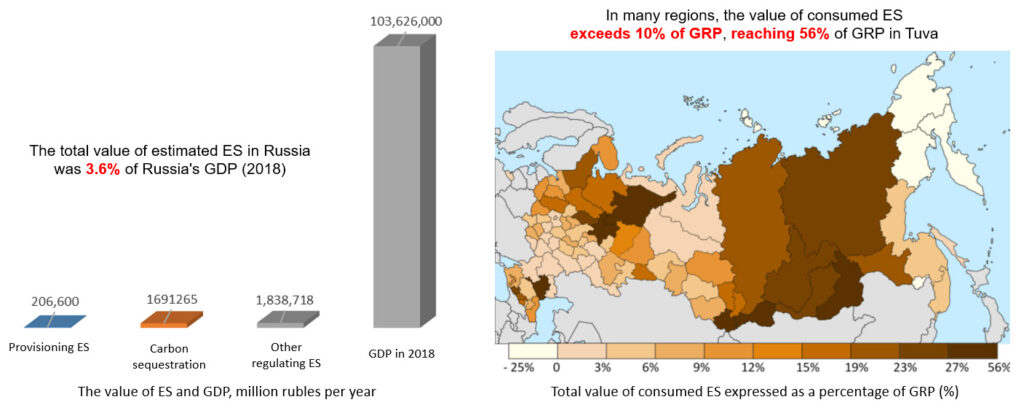
Regulating ES have the highest value among the ES estimated. Among provisioning ES, the most important are wood and fodder production. Among regulating ES, in addition to regulating CO2 flows, the most important are water regulating ES. The greatest value of regulating ES shows that a national or regional ES assessment made without their proper consideration (for example, mainly for provisioning or recreational ES) will be greatly underestimated and lead to poor management decisions.

6. Different scales of environmental decision-making. Approaches to management interpretation of ecosystem accounting data must take into account the scale of the managed territory. Relationships between indicators of ecosystem assets (biodiversity and ecosystems) and ecosystem services may be different at different spatial scales (see Section about correlations between indicators of ecosystem assets and services)