Seasonal runoff regulating (InVEST Seasonal Water Yield)
ES of regulating seasonal runoff by terrestrial ecosystem was estimated and mapped using InVEST Seasonal Water Yield module. Seasonal redistribution of runoff is extremely important for Armenia, which has a seasonal climate with dry summers over a significant part of the territory. The model takes into account the monthly amount of precipitation, soil permeability, and the water balance of each pixel, including moisture that comes into it from the overlying pixels. The main resulting indicators for assessing the ecosystem service are quick flow (QF), that is, the generation of streamflow with watershed residence times of hours to days; and baseflow (B), that is the generation of streamflow with watershed residence times of months to years. Values of cumulative baseflow (Bsum) show the flow through a pixel, contributed by all upslope pixels. Baseflow ensures runoff maintaining during the dry season and possible droughts.
The InVEST Seasonal Water Yield model diagram (from Hamel et al., 2020)

The main results of ES modeling and mapping
InVEST model outputs are proxy variables that should be interpreted in relative terms, rather than physical quantities. Nevertheless, the identified values are useful for analyzing the spatial distribution of services across the country’s territory and their balance with indicators of service utilization by the population and the economy.
This section presents preliminary results of testing models for assessing and mapping ecosystem services. In the future, if a decision is made to use these models, they should be calibrated using hydrological measurements made in Armenia.
The methodology and results will be described in detail in a forthcoming publication.
1. ES evaluation and mapping in physical indicators
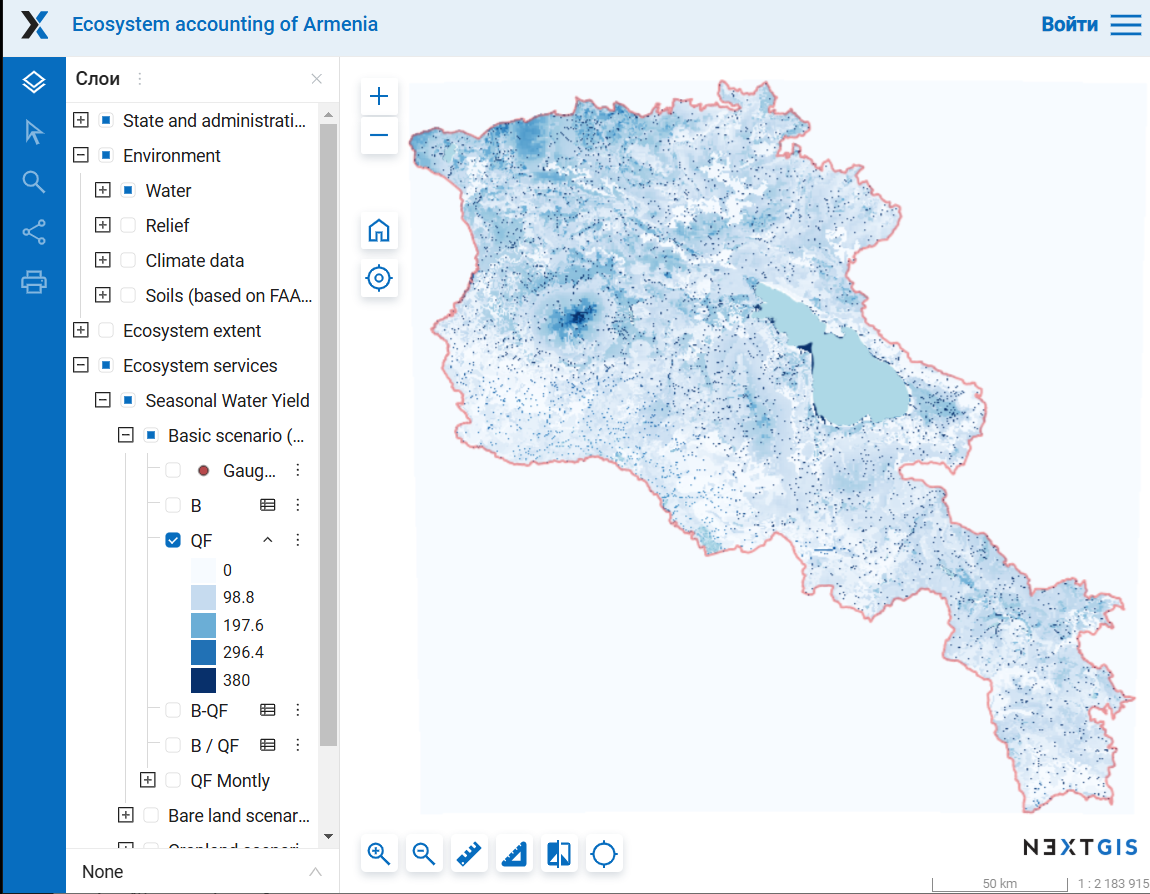
The baseflow values (B) for the actual land cover are much higher, while the quick flow (QF) values, on the contrary, are lower compared to hypothetical cases where all natural ecosystems are replaced with bare soil or croplands. The difference between runoff values for the actual land cover and bare soil can be interpreted as the ecosystem service provided by terrestrial vegetation: B = 47.8 mm in average, and QF = -22.2 mm in average.
Actual landcover 2023, B, mm (mean B=51.3) Actual landcover 2023, QF, mm (mean QF= 98.0)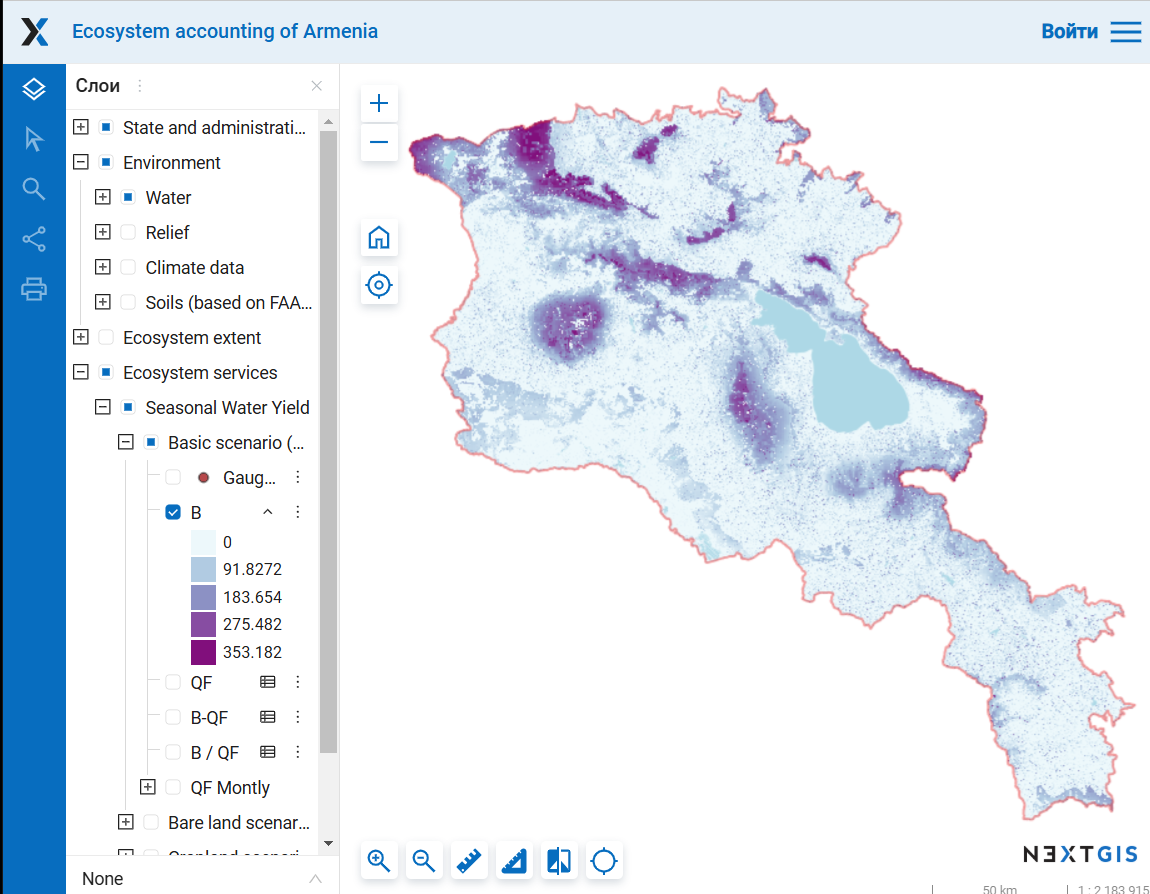
Bare ground, B, mm (mean B= 3.4) Bare ground, QF, mm (mean QF= 120.2)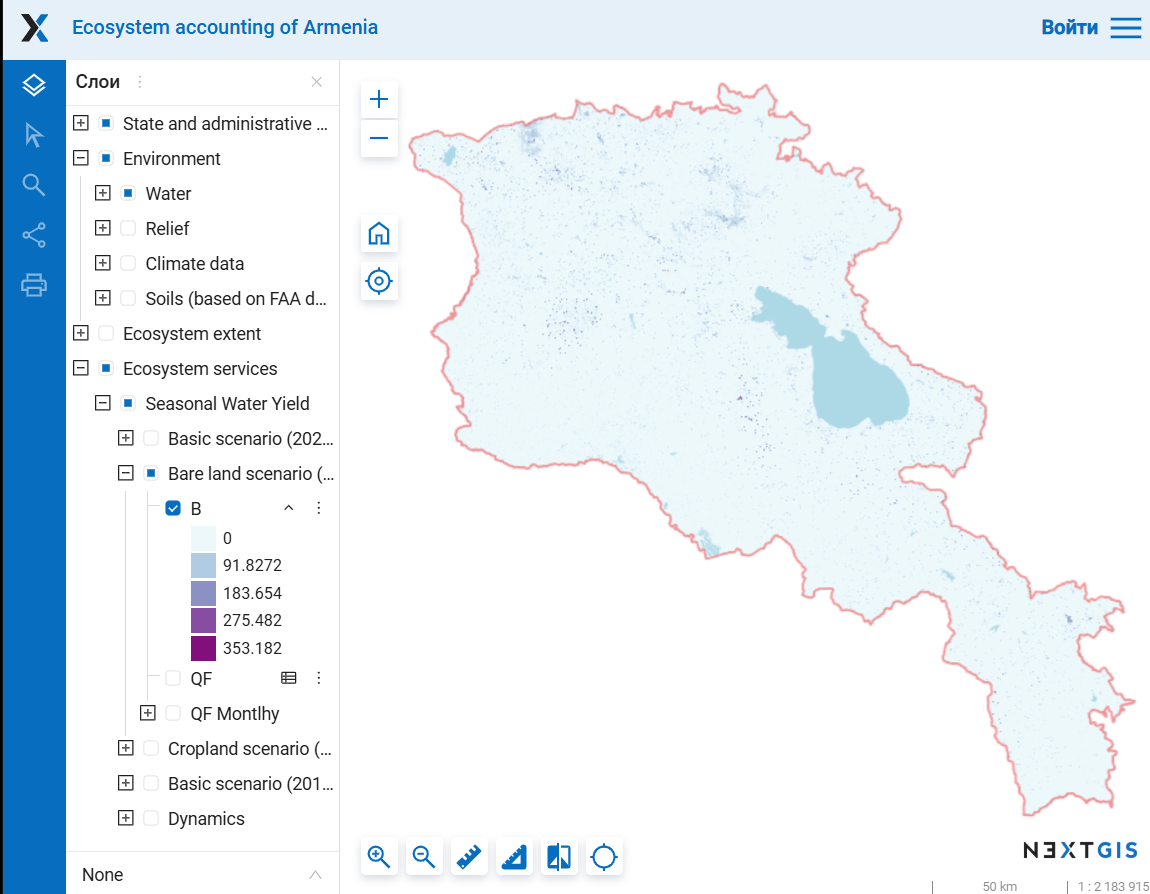
 Croplands, B, mm Croplands, QF, mm
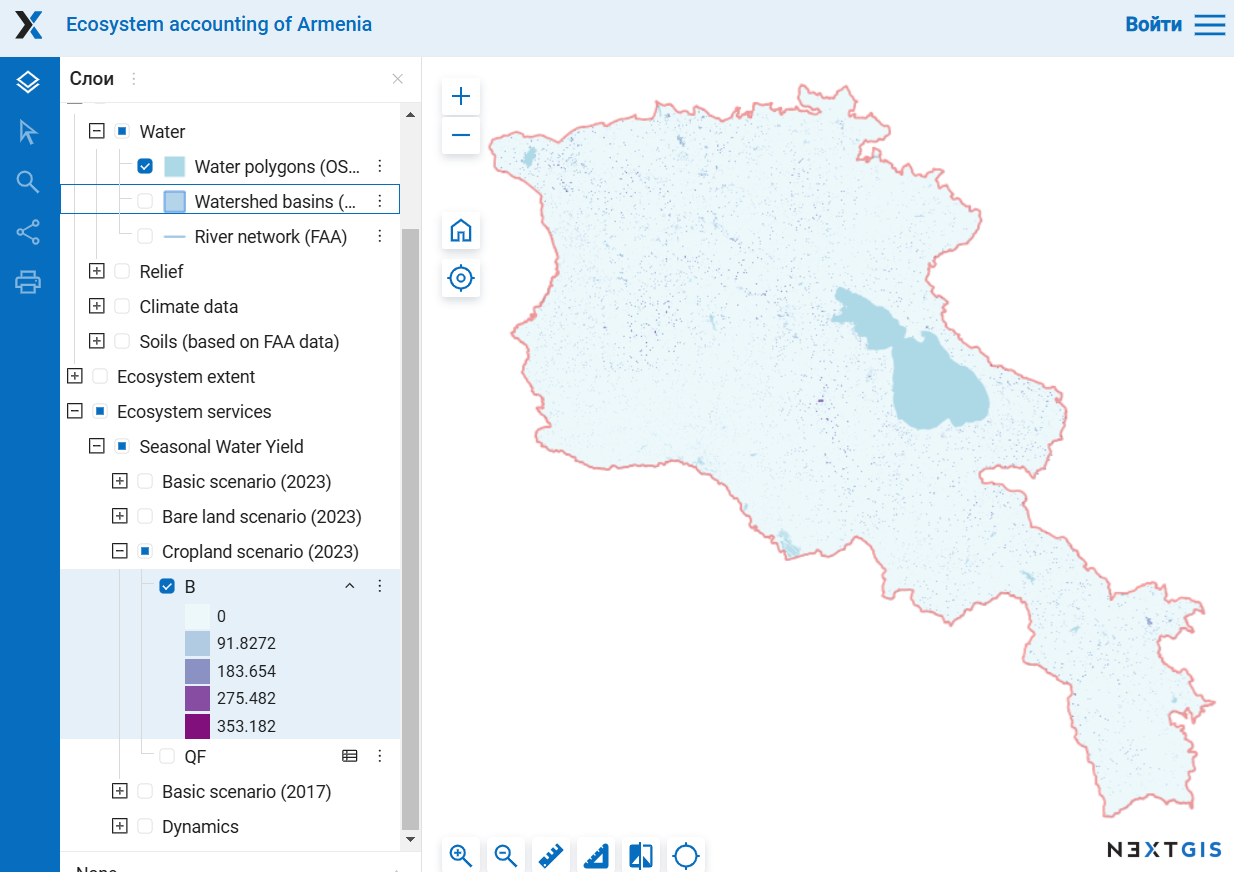
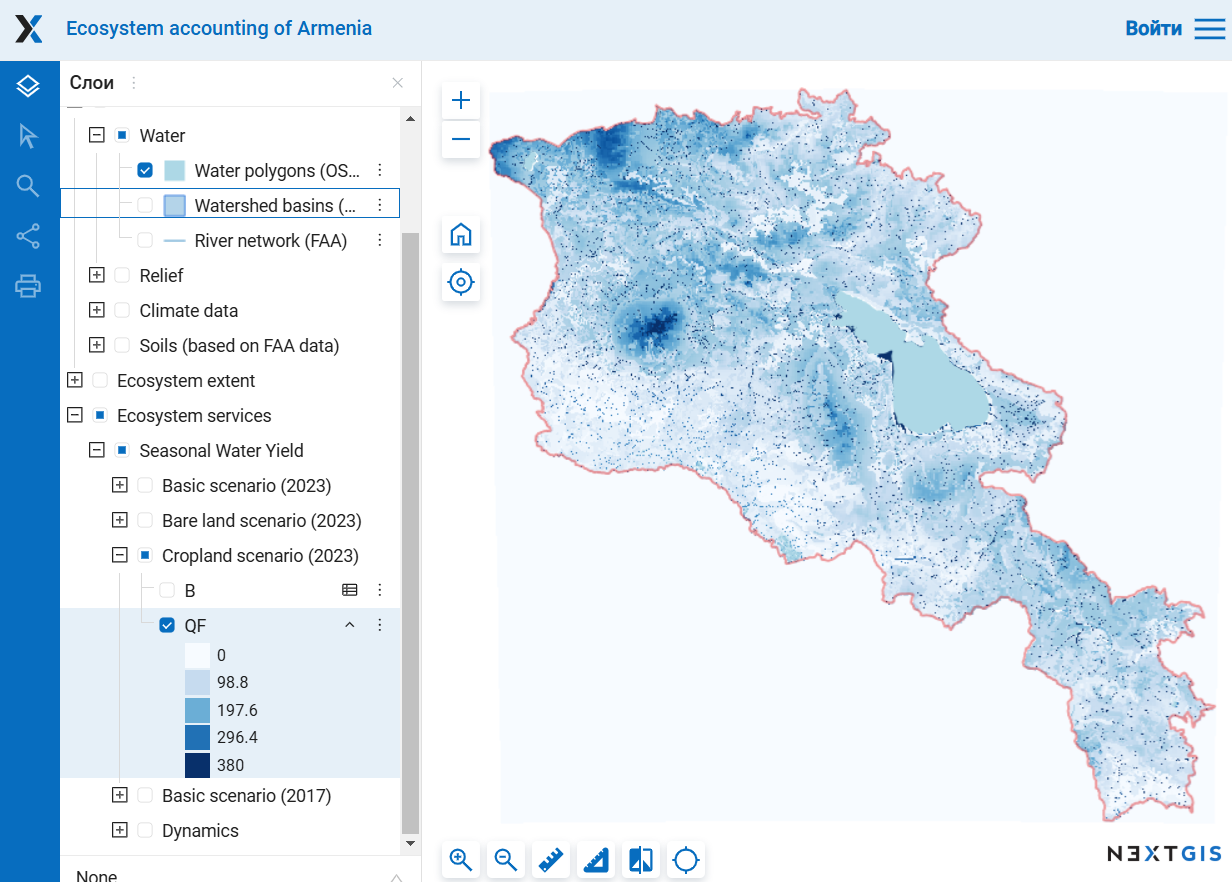
For detailed maps see section “Seasonal Water Yield” here
Terrestrial ecosystems provide more than 90% of the baseflow within watersheds and cumulative baseflow in the lower reaches of rivers
Average baseflow in the main watersheds and in Armenia as a whole for land cover 2023 and for scenario when all natural ecosystems are replaced by bare ground
| B with land cover 2023, mm | B on bare ground, mm | QF with land cover 2023, mm | QF on bare ground, mm | Total runoff (B+QF) with land cover 2023, mm | Share of B in total runoff with land cover 2023, % | Total runoff (B+QF) on bare ground, mm | Share of B in total runoff on bare ground, % | Share of B on bare groung in B whith land cover 2023, % | Share of B provided by terrestrial ecosystems, % | |
| Aghstev | 42 | 4 | 88 | 117 | 130 | 33 | 121 | 3 | 8.5 | 91.5 |
| Akhuryan | 73 | 5 | 121 | 138 | 194 | 38 | 143 | 3 | 6.8 | 93.2 |
| Arpa | 37 | 2 | 59 | 81 | 97 | 39 | 82 | 2 | 5.1 | 94.9 |
| Debed | 78 | 7 | 116 | 148 | 194 | 40 | 155 | 4 | 8.3 | 91.7 |
| Hrazdan | 53 | 3 | 132 | 150 | 185 | 29 | 153 | 2 | 5.8 | 94.2 |
| Metsamor | 50 | 3 | 78 | 91 | 128 | 39 | 94 | 3 | 5.5 | 94.5 |
| Vorotan | 31 | 2 | 79 | 105 | 110 | 28 | 107 | 2 | 7.3 | 92.7 |
| Armenia | 51 | 3 | 98 | 120 | 149 | 34 | 124 | 3 | 6.7 | 93.3 |
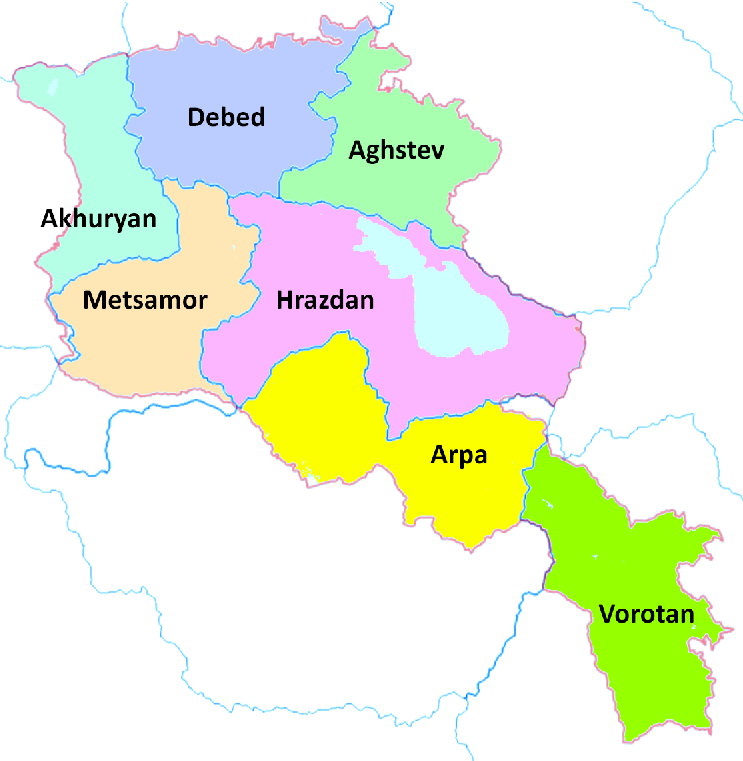
The analysis was made for parts of 6th-level watersheds (Hydrosheds), which are located on the territory of Armenia. These parts of the watersheds are further named after their largest rivers:
– Aghstev (involves Getik and Voskepar tributaries)
– Akhuryan
– Arpa (involves the Arpa River, the Azat River and the Vedi River)
– Debed (involves Pambak and Dzoraget tributaries)
– Hrazdan (involves two parts – Lake Sevan drainage basin and its outlet River Hrazdan)
– Metsamor (involves Kasagh tributary)
– Vorotan (involves Vorotan River, the Voghji River, and the Meghri River)
Cumulative baseflow in the lower river reaches for actual land cover 2023 and for scenario when all natural ecosystems are replaced by bare ground, mm
| Rivers | Bsum_2023 | Bsum_bare ground | Share of Bsum provided by terrestrial ecosystems, % |
| Aghstev | 686063872 | 53702228 | 92.2 |
| Akhuryan | 1562785152 | 82415360 | 94.7 |
| Argichi | 75929520 | 3704933 | 95.1 |
| Arpa | 313119360 | 11837469 | 96.2 |
| Azat | 349204672 | 11007498 | 96.8 |
| Debed | 2672169472 | 179894192 | 93.3 |
| Gavaraget | 422896480 | 13807621 | 96.7 |
| Hrazdan | 3543649536 | 154972240 | 95.6 |
| Masrik | 43279976 | 1879218.75 | 95.7 |
| Metsamor | 1676233984 | 72298784 | 95.7 |
| Vedi | 134872176 | 6922562 | 94.9 |
| Voghji | 75920344 | 4065560.75 | 94.6 |
| Vorotan | 300472096 | 15817257 | 94.7 |
With the current landcover, the baseflow is on average 35% of the total runoff (from 28 to 40% in different watersheds). With the bare soil scenario, the baseflow is only 3% (from 2 to 4%)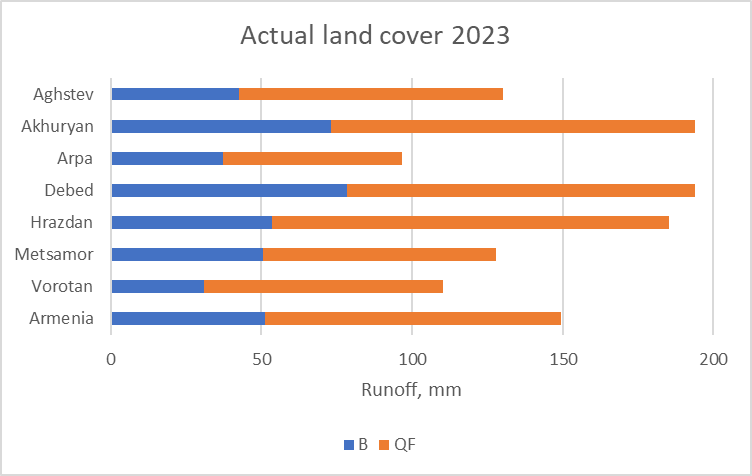

2. ES changes from 2017 to 2023
All changes identified are determined only by changes in the landcover. Weather and climate changes are not taken into account. From 2017 to 2023, there were slight changes in runoff indicators. However, overall, these changes can be interpreted as negative, as baseflow (B) decreased and quick flow (QF) increased. The most significant changes occurred in the Akhuryan. The reason is the expansion of the croplands at the expense of the grasslands in the Shirak marz (see here).
Changes in B, mm Changes in QF, mm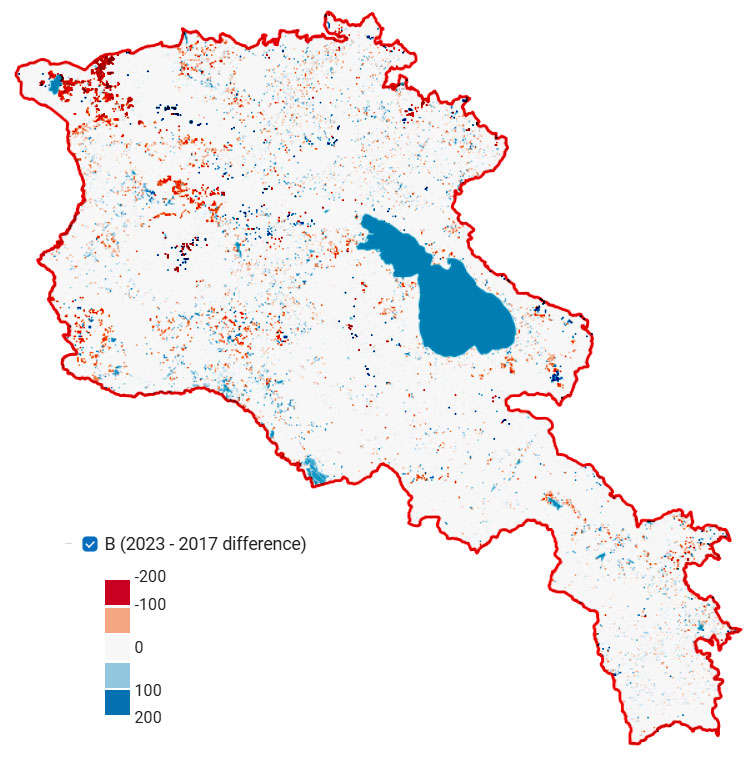
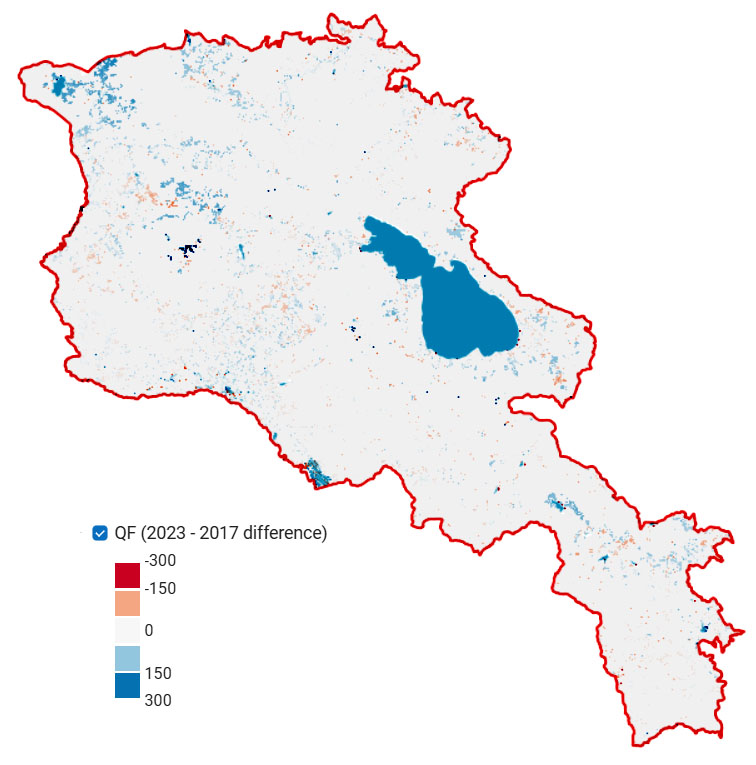
For detailed maps see sections “Seasonal Water Yield – Dynamics” here
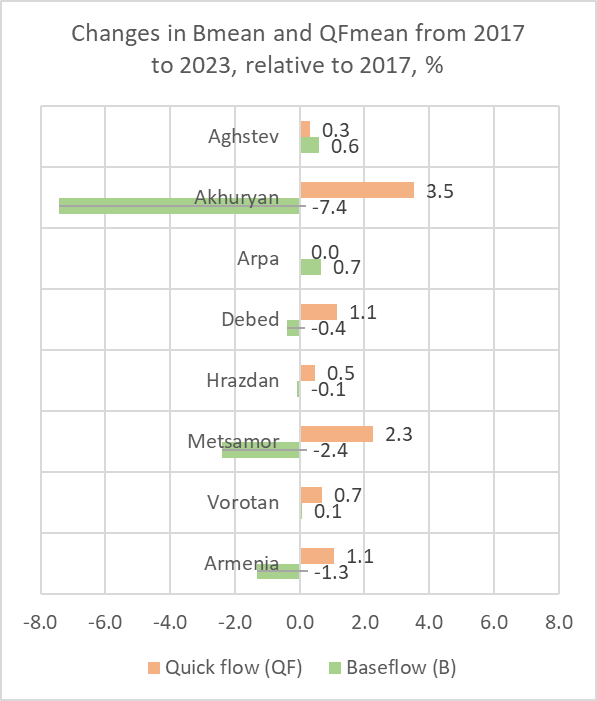
Changes in baseflow and quick flow from 2017 to 2023
in the in the basins of the largest rivers and in Armenia as a whole
| B mean, mm | Changes in B, % | QF mean, mm | Changes in QF, % | |||||
| 2017 | 2023 | Changes | 2017 | 2023 | Changes | |||
| Aghstev | 42.1 | 42.4 | 0.2 | 0.6 | 87.3 | 87.6 | 0.3 | 0.3 |
| Akhuryan | 79.0 | 73.2 | -5.9 | -7.4 | 116.6 | 120.7 | 4.1 | 3.5 |
| Arpa | 37.0 | 37.3 | 0.2 | 0.7 | 59.3 | 59.3 | 0.0 | 0.0 |
| Debed | 78.6 | 78.3 | -0.3 | -0.4 | 114.3 | 115.6 | 1.3 | 1.1 |
| Hrazdan | 53.5 | 53.4 | 0.0 | -0.1 | 131.4 | 132.0 | 0.6 | 0.5 |
| Metsamor | 51.7 | 50.4 | -1.2 | -2.4 | 75.8 | 77.5 | 1.7 | 2.3 |
| Vorotan | 31.0 | 31.0 | 0.0 | 0.1 | 78.6 | 79.2 | 0.5 | 0.7 |
| Armenia | 52.0 | 51.3 | -0.7 | -1.3 | 97.0 | 98.0 | 1.0 | 1.1 |
Cumulative baseflow (Bsum) in the lower reaches has decreased most in the Akhuryan River (-9.25%), and the Metsamor River (-3.03%), while in Voghji River it has visibly grown (+5.28%)
Changes in cumulative baseflow in the lower river reaches from 2017 to 2023
| Rivers | Bsum 2023, mm | Bsum 2017, mm | Changes, mm | Changes, % relative to 2017 |
| Aghstev | 686,063,872 | 685,638,016 | 425,856 | 0.06 |
| Akhuryan | 1,562,785,152 | 1,722,085,760 | -159,300,608 | -9.25 |
| Argichi | 75,929,520 | 75,653,040 | 276,480 | 0.37 |
| Arpa | 313,119,360 | 309,875,328 | 3,244,032 | 1.05 |
| Azat | 349,204,672 | 345,485,152 | 3,719,520 | 1.08 |
| Debed | 2,672,169,472 | 2,684,654,848 | -12,485,376 | -0.47 |
| Gavaraget | 422,896,480 | 425,799,968 | -2,903,488 | -0.68 |
| Hrazdan | 3,543,649,536 | 3,543,354,368 | 295,168 | 0.01 |
| Masrik | 43,279,976 | 42,957,568 | 322,408 | 0.75 |
| Metsamor | 1,676,233,984 | 1,728,691,072 | -52,457,088 | -3.03 |
| Vedi | 134,872,176 | 132,632,480 | 2,239,696 | 1.69 |
| Voghji | 75,920,344 | 72,110,264 | 3,810,080 | 5.28 |
| Vorotan | 300,472,096 | 300,990,784 | -518,688 | -0.17 |

3. The degree of ES use and the degree of satisfaction of the need for it
This section is based on a comparison of runoff estimates by the SWY InVEST model and data on water consumption from ArmStat regional statistics.
Water use in marzes in 2023, mln m3
| Marzes | Drinking, domestic | Industry, communal, building | Agriculture, fish breeding, forestry | Total use |
| Aragatsotn | 3.7 | 1.3 | 226.3 | 231.3 |
| Ararat | 6.7 | 6 | 799.3 | 812 |
| Armavir | 10.2 | 13.5 | 514.1 | 537.8 |
| Gegharkunik | 24.5 | 0.8 | 29 | 54.3 |
| Kotayk | 8.6 | 8.6 | 147.1 | 164.3 |
| Lori | 9.3 | 5.7 | 3 | 18 |
| Shirak | 7.9 | 2.2 | 53 | 63.1 |
| Syunik | 16.3 | 57.1 | 6 | 79.4 |
| Tavush | 8.1 | 1.7 | 11.1 | 20.9 |
| Vayots Dzor | 2.4 | 0.5 | 21 | 23.9 |
| Yerevan city | 59.8 | 40.6 | 156.5 | 256.9 |
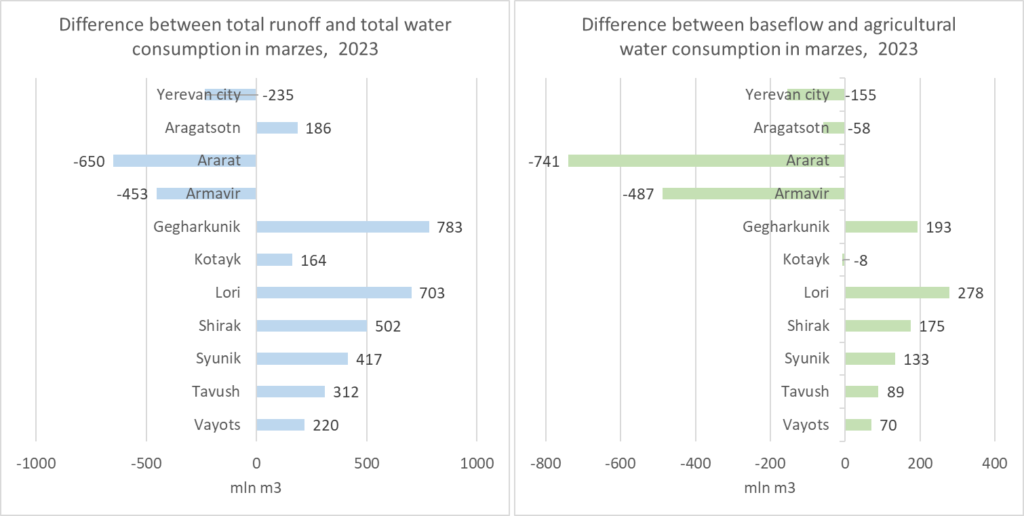
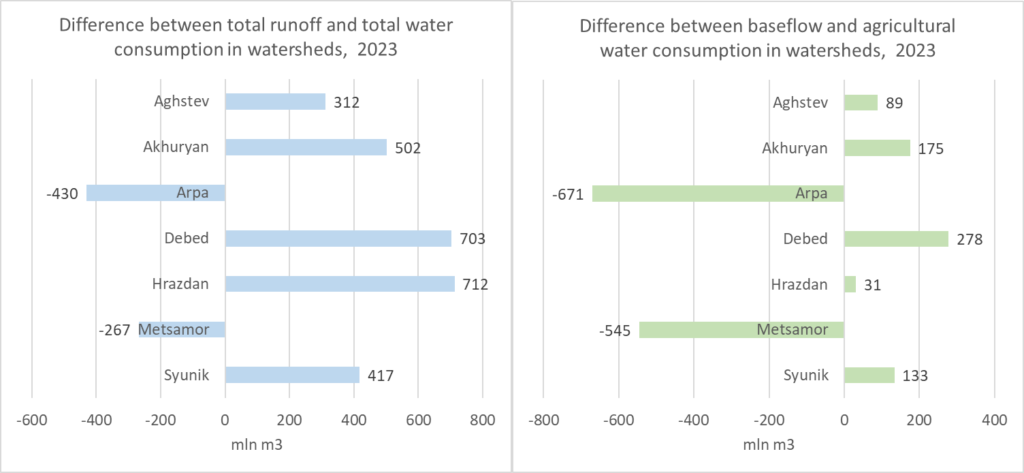
Ararat, Armavir and Yerevan city are water-deficient marzes. The runoff from their territory is significantly less than the water consumption. The total runoff from the territories of other marzes provides the total water consumption.
Baseflow is most important for agricultural water use because it provides flow during the hot summer months when water demand is greatest. Baseflow residence time spans months to years and the baseflow is distributed throughout this period, not just in the summer months. However, the comparison of baseflow and agricultural water use can be useful for assessing the water deficit in marzes. In these terms, the Ararat and Armavir marzes become even more water-deficient. Baseflow is less than agricultural water use also in Yerevan city and marzes Aragatsotn and Kotayk.
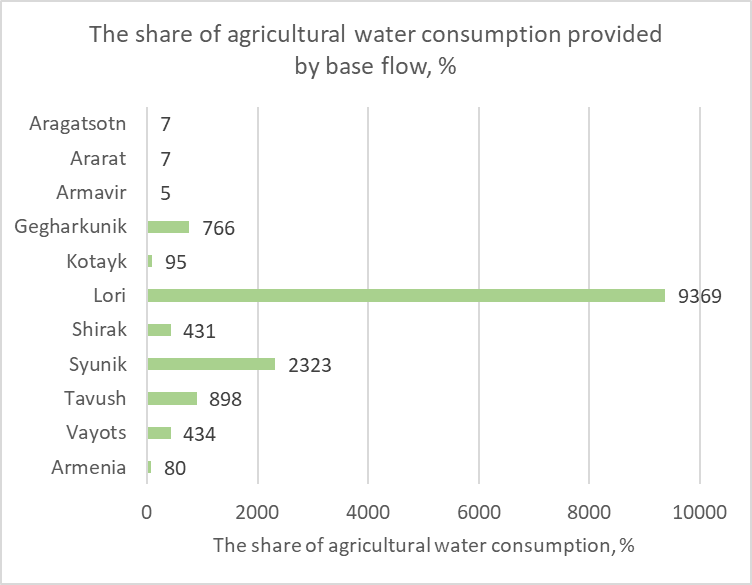
In the Aragatsotn, Ararat, and Armavir and marzes baseflow provides 5-7% of agricultural water consumption, in Kotayk 95% (it should be remembered that this figure does not include the flow from Sevan), in other marzes the baseflow is several times higher than water consumption.
| Baseflow, mln m3 | Quick flow, mln m3 | Total runoff, mln m3 | Water use in agriculture, fish breeding, forestry, mln m3 | Total water consum-ption, mln m3 | Difference between total runoff and total water consumption in marzes, 2023 | Difference between baseflow and agricultural water consumption in marzes, 2023 | Share of baseflow in agricultural consumption, % | |
| Vayots Dzor | 91 | 152 | 243 | 21 | 24 | 220 | 70 | 434 |
| Tavush | 100 | 233 | 333 | 11 | 21 | 312 | 89 | 898 |
| Syunik | 139 | 357 | 496 | 6 | 79 | 417 | 133 | 2323 |
| Shirak | 228 | 337 | 565 | 53 | 63 | 502 | 175 | 431 |
| Lori | 281 | 440 | 721 | 3 | 18 | 703 | 278 | 9369 |
| Kotayk | 139 | 189 | 328 | 147 | 164 | 164 | -8 | 95 |
| Gegharkunik | 222 | 615 | 838 | 29 | 54 | 783 | 193 | 766 |
| Armavir | 27 | 58 | 85 | 514 | 538 | -453 | -487 | 5 |
| Ararat | 59 | 104 | 162 | 799 | 812 | -650 | -741 | 7 |
| Aragatsotn | 168 | 249 | 418 | 226 | 231 | 186 | -58 | 7 |
The boundaries of marzes largely coincide with the boundaries of large basins
| Basins | Marzes |
| Aghstev | Tavush |
| Akhuryan | Shirak |
| Arpa | Ararat and Vayots Dzor |
| Debed | Lori |
| Hrazdan | Gegharkunik, Kotaik and Erevan city |
| Metsamor | Armavir and Aragatsotn |
| Vorotan | Syunik |
If errors caused by discrepancies between watershed and marz boundaries are disregarded, it is possible to roughly estimate the ratio of provided to utilized services in the basins. According to this rough estimate, water consumption exceeds runoff in Arpa and Metsamor watersheds, which means that the population and economy in these basins consume underground waters or surface water from other watersheds.
4. A small by-product for education
The Seasonal Water Yield module requires data on the distribution of monthly precipitation across the territory of Armenia. However, the module does not account for the snow period when snow does not melt, and, consequently, there is no liquid precipitation. To address this, we have estimated the amount of liquid precipitation in Armenia by months. In addition to being used in the model, these results may be useful in explaining the climate characteristics of Armenia to a wider audience.
References
Hamel, P., Valencia, J., Schmitt, R., Shrestha, M., Piman, T., Sharp, R. P., Francesconi, W., & Guswa, A. J. (2020). Modeling seasonal water yield for landscape management: Applications in Peru and Myanmar. Journal of Environmental Management, 270, 110792. https://doi.org/10.1016/j.jenvman.2020.110792