Accounting of natural landscapes
1. Extent of natural landscapes
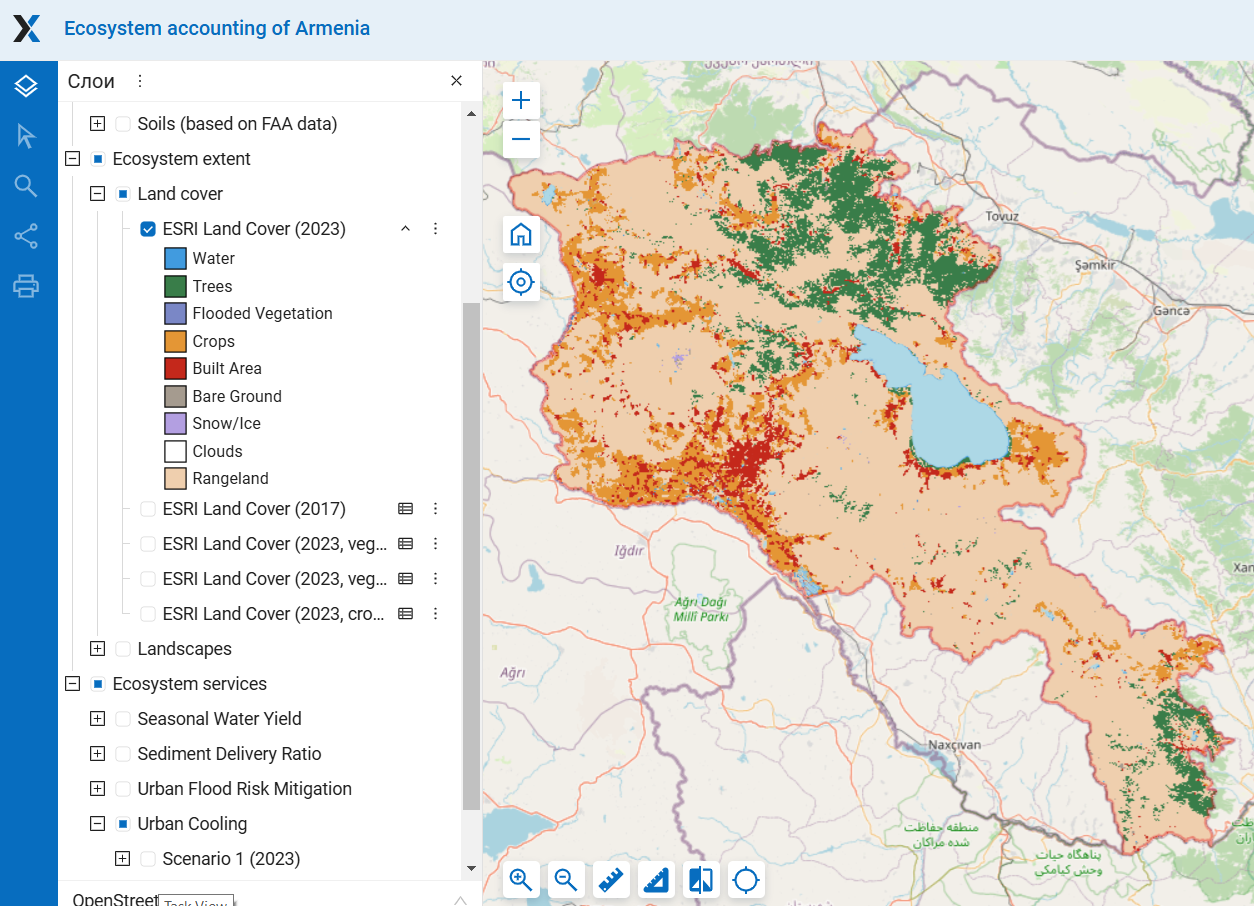
To estimate extent of natural terrestrial landscapes, the map of landscape zones published in the Fifth National Report of Armenia to the CBD (2014) was used (available in digital form in Forest Atlas of Armenia FAA), along with land cover data of ESA 2021 and ESRI 2017 and 2023.
Landscape zones 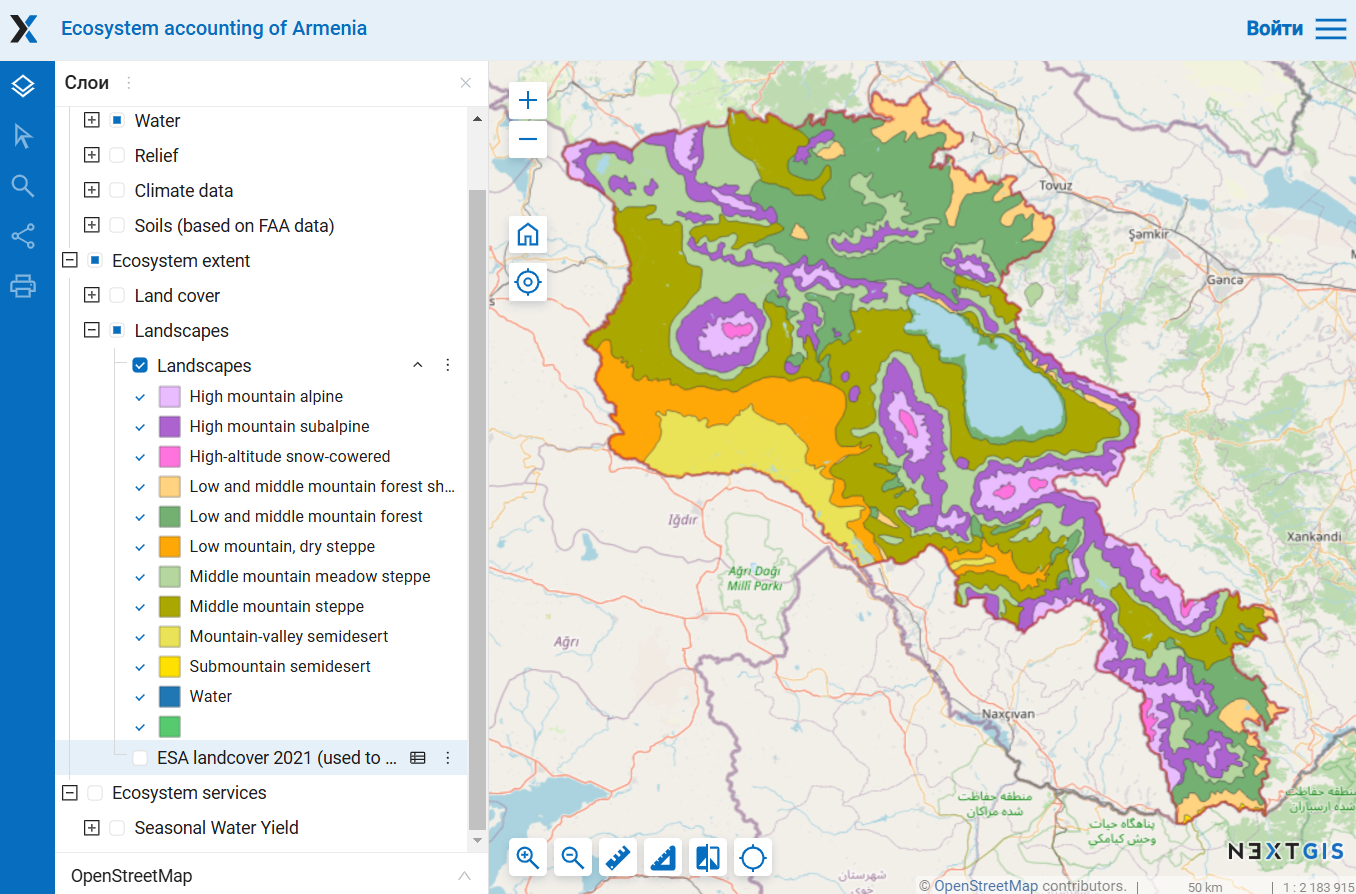
Land cover ESA 2021 Land cover ESRI 2023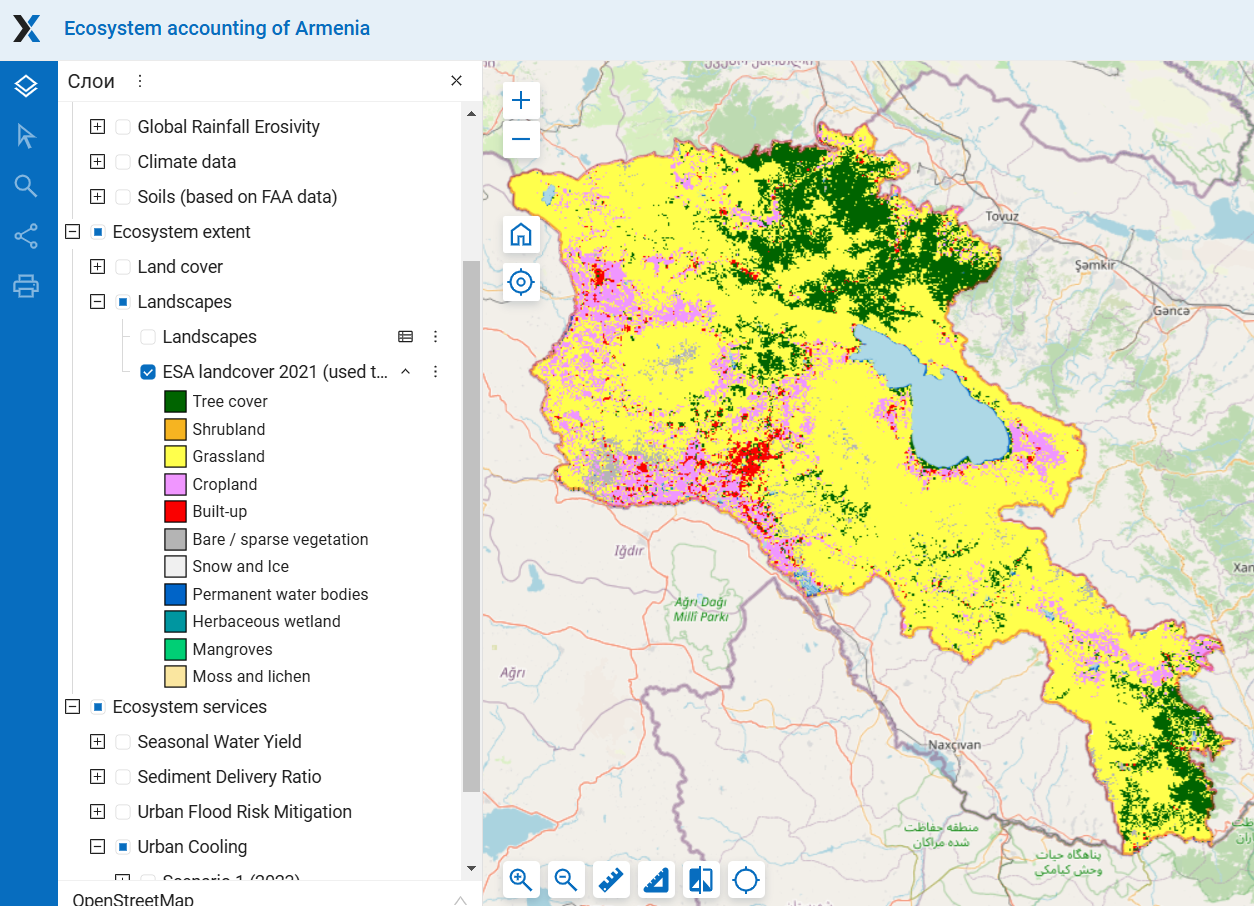
 For detailed maps see section “Ecosystem extent”
The area of natural terrestrial landscapes was calculated as the area of a given landscape zone in the whole Armenia and in provinces minus waterbodies and anthropogenically transformed territories, that is, built-up areas and croplands (Tables). Differences in area between entire landscape zones and natural landscapes are most noticeable in zones, which have been most transformed by human activity.
The share of landscape area of Armenia’s total area, %
Opening the image in a new window will allow you to view it slightly larger
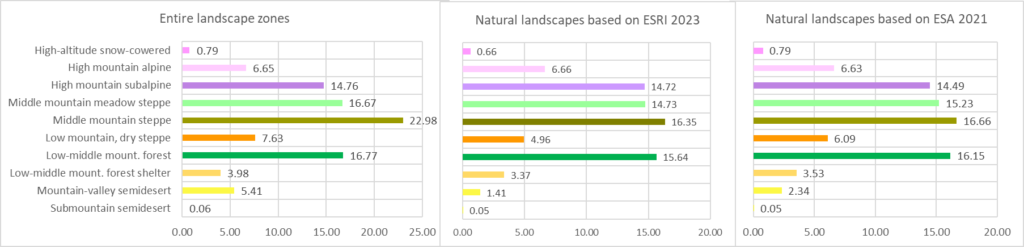
The slight difference in the area of natural landscapes determined on the base of ESRI and ESA land cover data is explained by the varying areas of built-up and cropland within these land cover datasets.
Generally, the semi-desert landscapes have been most significantly transformed by human activity, with croplands and built-up areas occupying together more than half of the area. Steppe landscapes have also undergone noticeable transformation. In mountain forests croplands and built-up areas occupy 4%. Higher mountainous areas are the least transformed by human activity.
Area of natural landscapes in provinces (excluding Yerevan) (Tables).
Opening the image in a new window will allow you to view it slightly larger

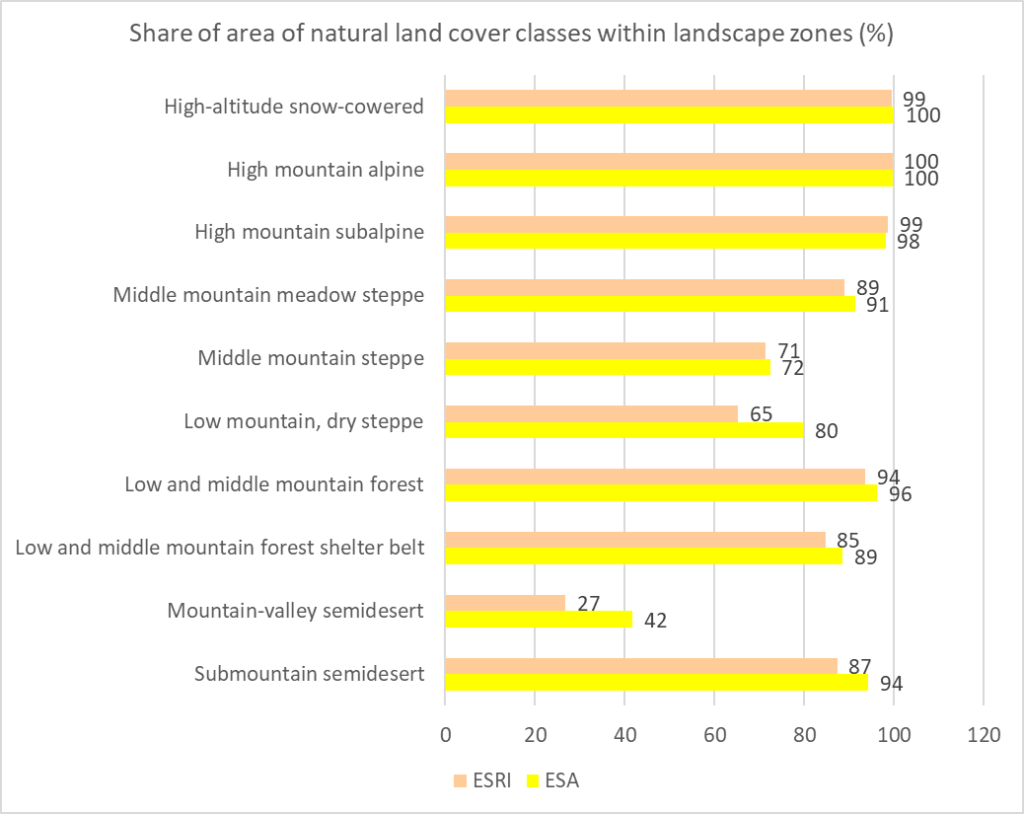
Share of area of different land cover classes within landscape zones, % (on the left) and the share of natural landscapes, % (on the right)
Statistical tables
Opening the image in a new window will allow you to view it slightly larger
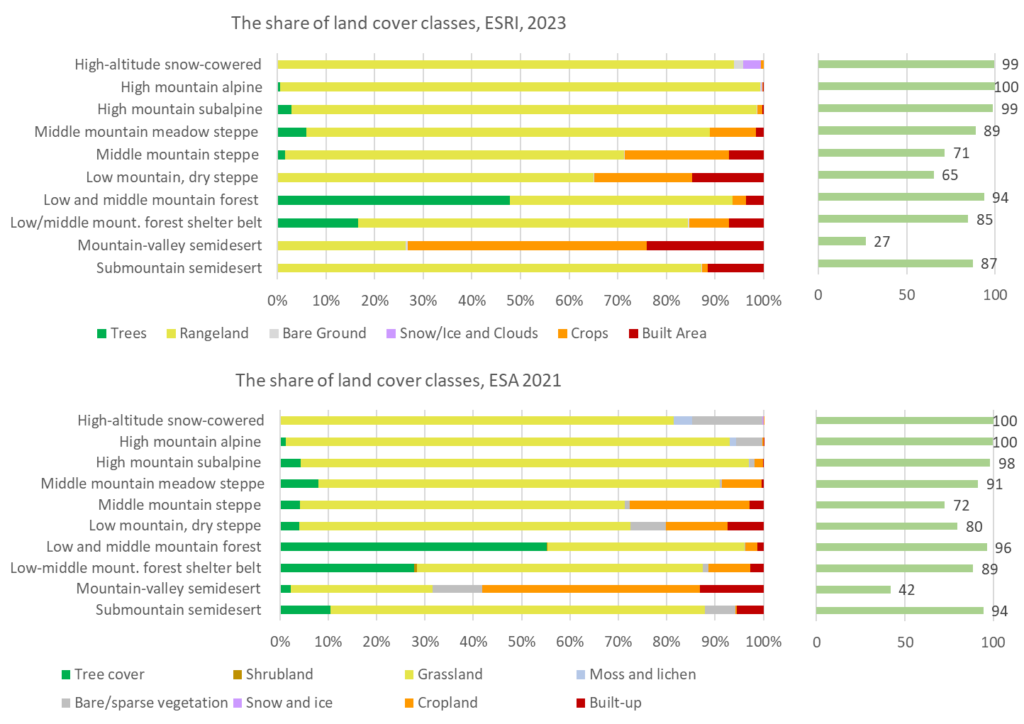
In most cases, the ESRI land cover dataset shows more natural classes than the ESA dataset. The ESA dataset identifies less built-up areas and croplands. A visual comparison of the land covers shows that the outlines of built-up areas and croplands roughly align, but in the ESA dataset, croplands are represented as a scattering of small patches with grasslands and trees in between, whereas in the ESRI dataset, they appear as dense, consolidated areas (see section “Ecosystem extent”). The most significant differences were observed for low mountain dry steppe and mountain valley semi-desert.
Nevertheless, according to both land cover datasets, the most anthropogenically transformed landscape zone is mountain-valley semi-desert, followed by low and middle mountain steppes, while the least transformed are the mountainous landscapes.
2. Assessment of the importance of provinces for conserving natural landscapes and LLCCs in Armenia
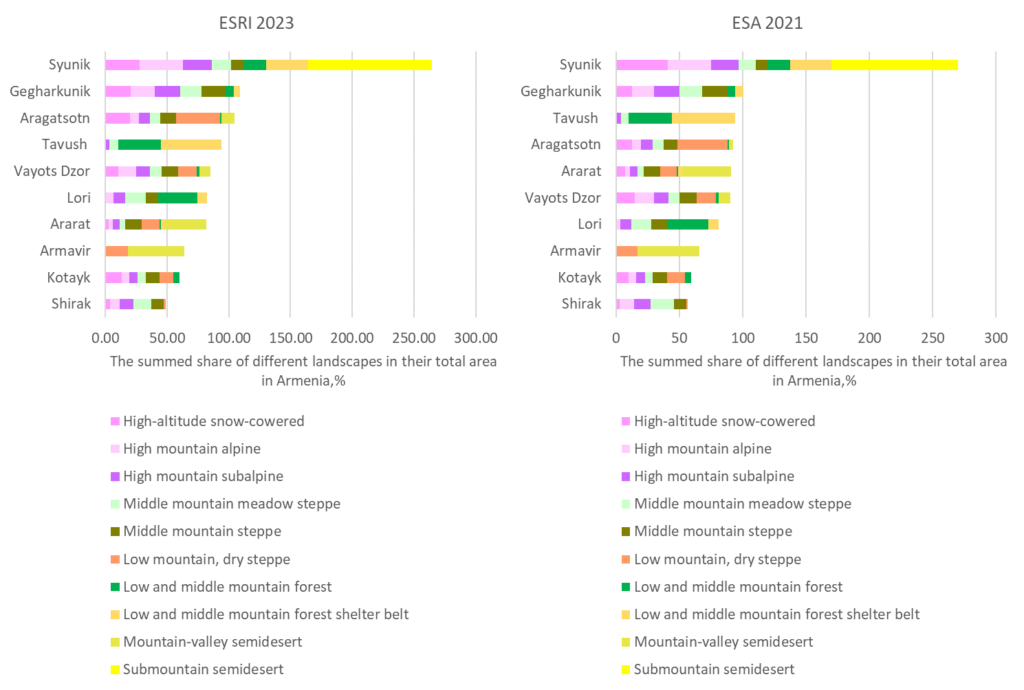
To assess the importance of provinces for conserving natural landscapes in Armenia, we used the indicator of the total share of landscape areas located within each province relative to the total area of that landscape in Armenia. This approach was applied to ensure that the value of rare landscapes is not diminished.
The rankings based on ESRI and ESA data are very similar, differing only in the positions of some provinces with similar indicators in the middle of the list.
The rankings of the importance of provinces for conserving natural landscapes in Armenia. The total percentage for provinces can exceed 100%.
Statistical tables
Opening the image in a new window will allow you to view it slightly larger
3. Changes in landscape extent from 2017 to 2023 according to ESRI data
The area of some natural landscapes has changed by several percent due to changes in the area of croplands and built-up areas, as described in the Section “Extent of land cover classes“.
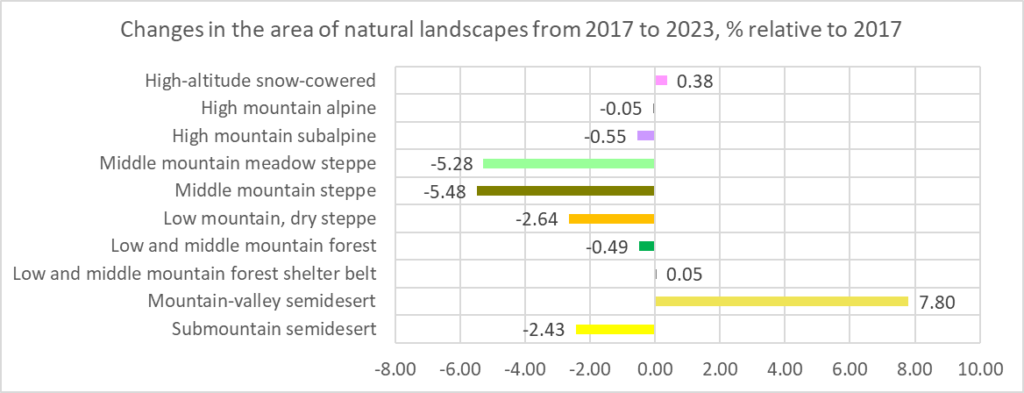
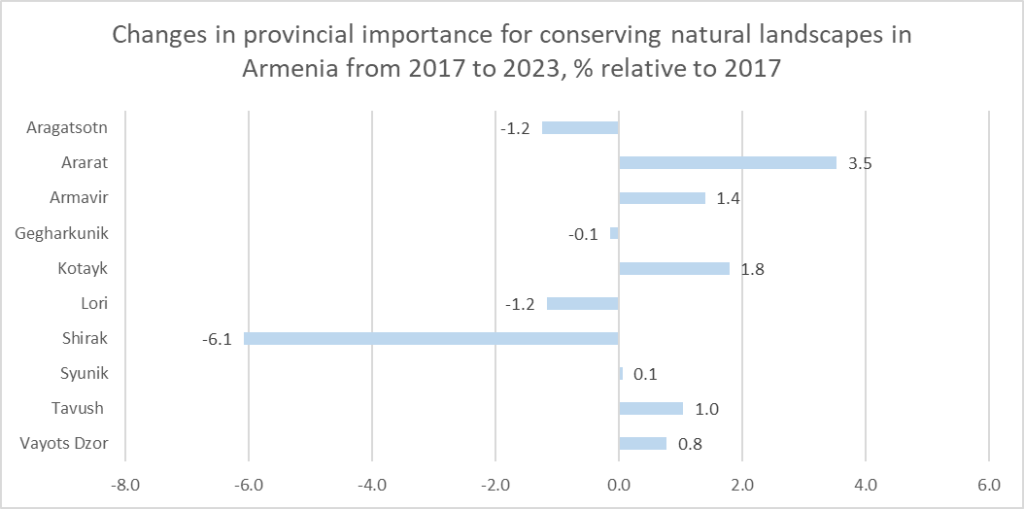
We also identified the provinces where the area of natural landscapes changed the most significantly (note that the figure below shows changes not in kilometers, but as percentages relative to 2017).
Changes in the area of natural landscapes from 2017 to 2023, % relative to 2017
Opening the image in a new window will allow you to view it slightly larger
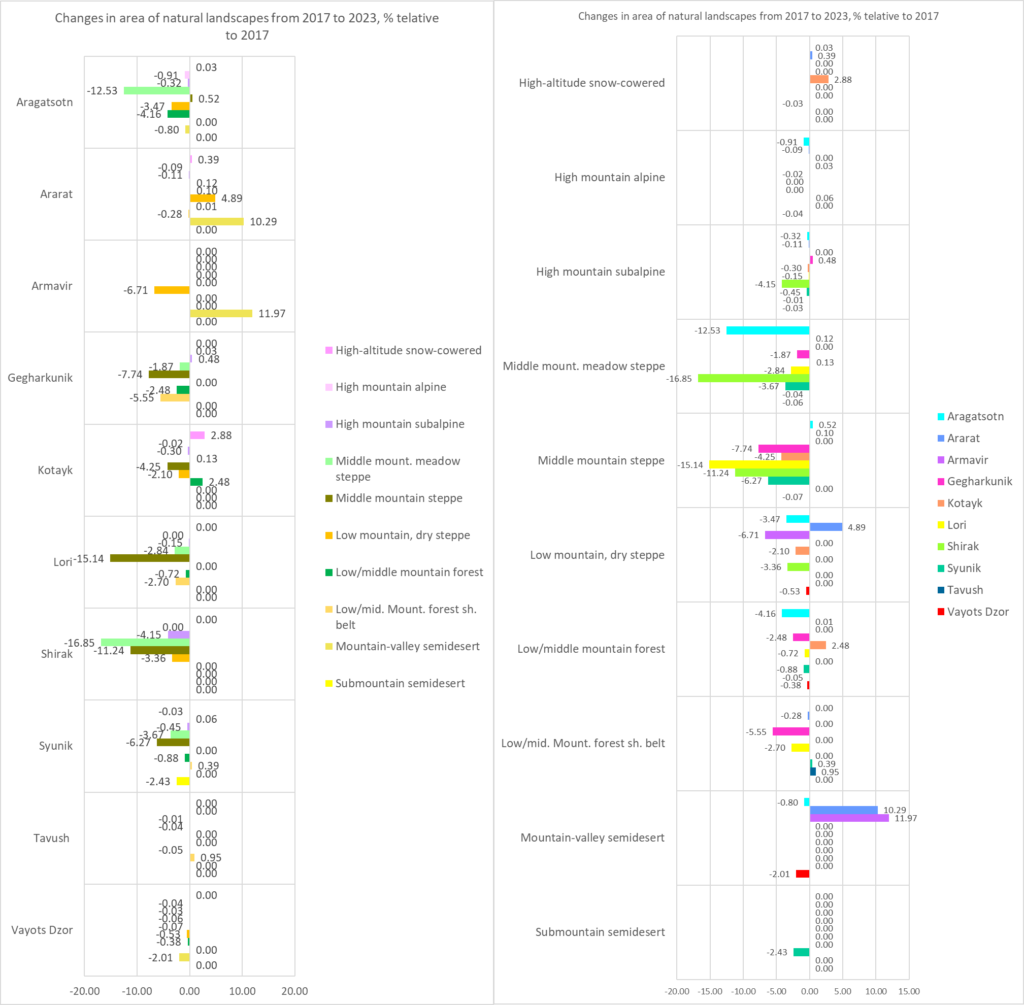
Changes in the area of natural landscapes from 2017 to 2023, % relative to 2017
| Sub-mountain semi-desert | Mountain-valley semi-desert | Low/mid. Mount. forest sh. belt | Low/middle mountain forest | Low mountain, dry steppe | Middle mountain steppe | Middle mount. meadow steppe | High mountain subalpine | High mountain alpine | High-altitude snow-cowered | |
| Aragatsotn | 0.00 | -0.80 | 0.00 | -4.16 | -3.47 | 0.52 | -12.53 | -0.32 | -0.91 | 0.03 |
| Ararat | 0.00 | 10.29 | -0.28 | 0.01 | 4.89 | 0.10 | 0.12 | -0.11 | -0.09 | 0.39 |
| Armavir | 0.00 | 11.97 | 0.00 | 0.00 | -6.71 | 0.00 | 0.00 | 0.00 | 0.00 | 0.00 |
| Gegharkunik | 0.00 | 0.00 | -5.55 | -2.48 | 0.00 | -7.74 | -1.87 | 0.48 | 0.03 | 0.00 |
| Kotayk | 0.00 | 0.00 | 0.00 | 2.48 | -2.10 | -4.25 | 0.13 | -0.30 | -0.02 | 2.88 |
| Lori | 0.00 | 0.00 | -2.70 | -0.72 | 0.00 | -15.14 | -2.84 | -0.15 | 0.00 | 0.00 |
| Shirak | 0.00 | 0.00 | 0.00 | 0.00 | -3.36 | -11.24 | -16.85 | -4.15 | 0.00 | 0.00 |
| Syunik | -2.43 | 0.00 | 0.39 | -0.88 | 0.00 | -6.27 | -3.67 | -0.45 | 0.06 | -0.03 |
| Tavush | 0.00 | 0.00 | 0.95 | -0.05 | 0.00 | 0.00 | -0.04 | -0.01 | 0.00 | 0.00 |
| Vayots Dzor | 0.00 | -2.01 | 0.00 | -0.38 | -0.53 | -0.07 | -0.06 | -0.03 | -0.04 | 0.00 |